
Without deeper insights, ad spend often turns into wasted spend. In 2022 alone, $5.6 billion of digital ad spend went down the drain, that’s 41% of total digital advertising spend. The culprit? Brands focusing on surface-level metrics like CTR, CPC, and impressions.
While these numbers look good on a dashboard, they don’t tell you what really matters - who’s converting, what’s driving sales, and which campaigns actually move revenue. For eCommerce brands, every click should connect to a purchase, not just a page view.
That’s why creating insightful, conversion-driven Google Ads reports is crucial. It’s not about tracking more data; it’s about tracking the right data. When your reporting goes beyond vanity metrics and digs into performance drivers, you stop guessing and start scaling smarter.
Let’s break down how to build Google Ad reports that reveal true ROI and help you make every ad dollar count.
Most marketers think they’re doing great reporting when they track clicks, impressions, and CTRs. But those metrics only show activity, not impact.
You might be driving tons of traffic, but unless that traffic is converting profitably, you’re flying blind. An insightful Google Ads report doesn’t just tell you what happened, it tells you why it happened and what to do next. That’s where real growth starts.
CTR and CPC tell you how users interact with your ads, but they don’t tell you how those interactions affect your bottom line. Insightful reporting means zooming out from engagement to outcomes like revenue generated, return on ad spend (ROAS), and cost per order (CPO). These metrics directly tie ad performance to profitability, helping you see which campaigns deserve more investment and which are draining budget.
Standard Google Ads dashboards often stop at the click. But a single click rarely tells the whole story in eCommerce. Customers browse, compare, and return later through other channels. That’s why multi-touch attribution is critical - it shows which ads played a real role in the conversion journey. Insightful reports look at assisted conversions, first-click impact, and lifetime value rather than last-click sales alone.
The biggest misconception? Thinking Google Ads alone holds all the answers. In reality, you need to connect your ad data with Shopify, GA4, or CRM data to uncover the full picture. Standard dashboards don’t tell you that your highest CTR campaign might have the lowest profit margin. True insights emerge when you blend performance data with business context, transforming raw numbers into smart decisions that grow revenue sustainably.
Building an insightful Google Ads report is about connecting the dots between marketing effort and business outcome. When done right, your report becomes a decision-making tool, not just a performance recap. Here’s how to create one that truly matters.
Start with why. What’s the real goal behind your ad campaigns? More clicks? Probably not. For eCommerce brands, the goal usually revolves around sales growth, customer acquisition cost (CAC), or revenue efficiency.
When you define goals clearly, your metrics automatically align. For example, if your goal is to increase repeat purchases, focusing solely on ROAS might mislead you. You also need to track Customer Lifetime Value (CLTV) and Repeat Purchase Rate.
%20and%20Repeat%20Purchase%20Rate.jpg)
When KPIs are business-aligned, reporting shifts from “How did ads perform?” to “How did ads impact growth?”
Here’s where most Google Ads reports fall short. They rely only on ad platform metrics, ignoring the sales and product-side performance that complete the picture.
To make reports insightful, you need to merge multiple data streams - marketing data from Google Ads, sales data from your store, and product profitability data from your backend.
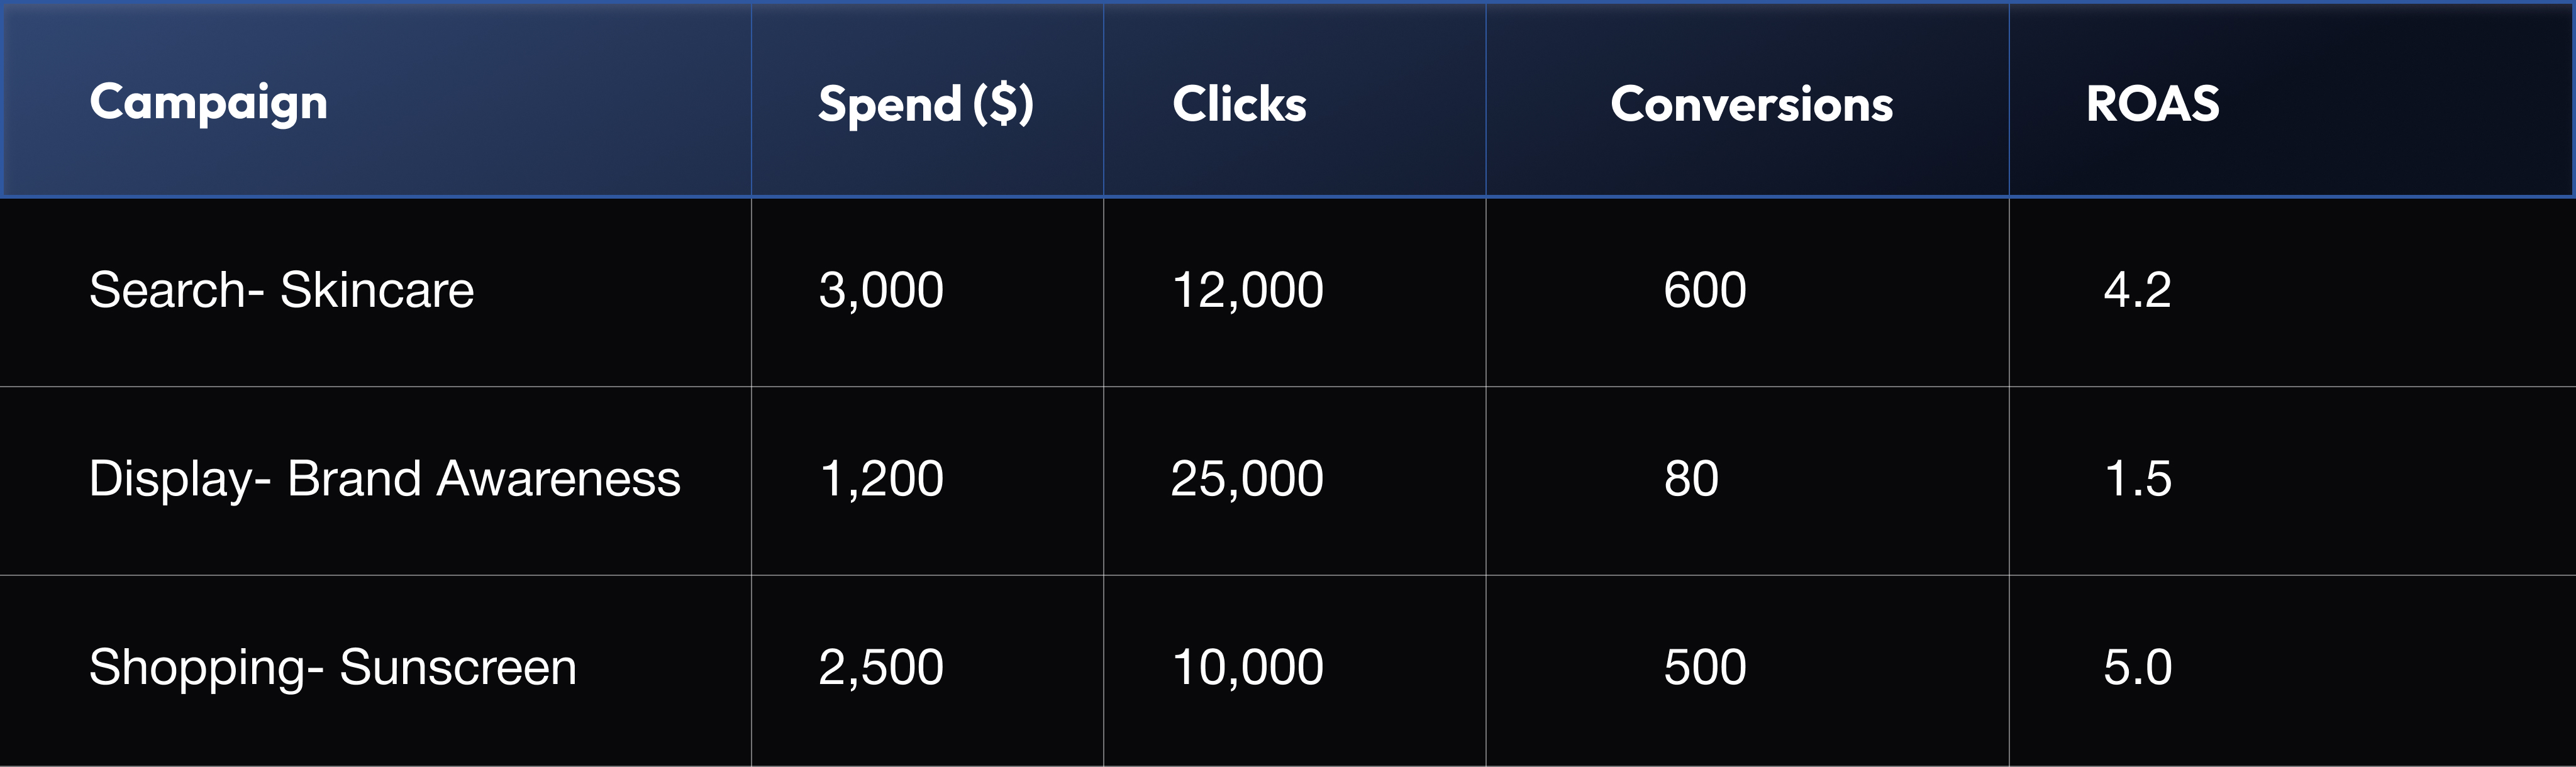
Marketing Data Example:
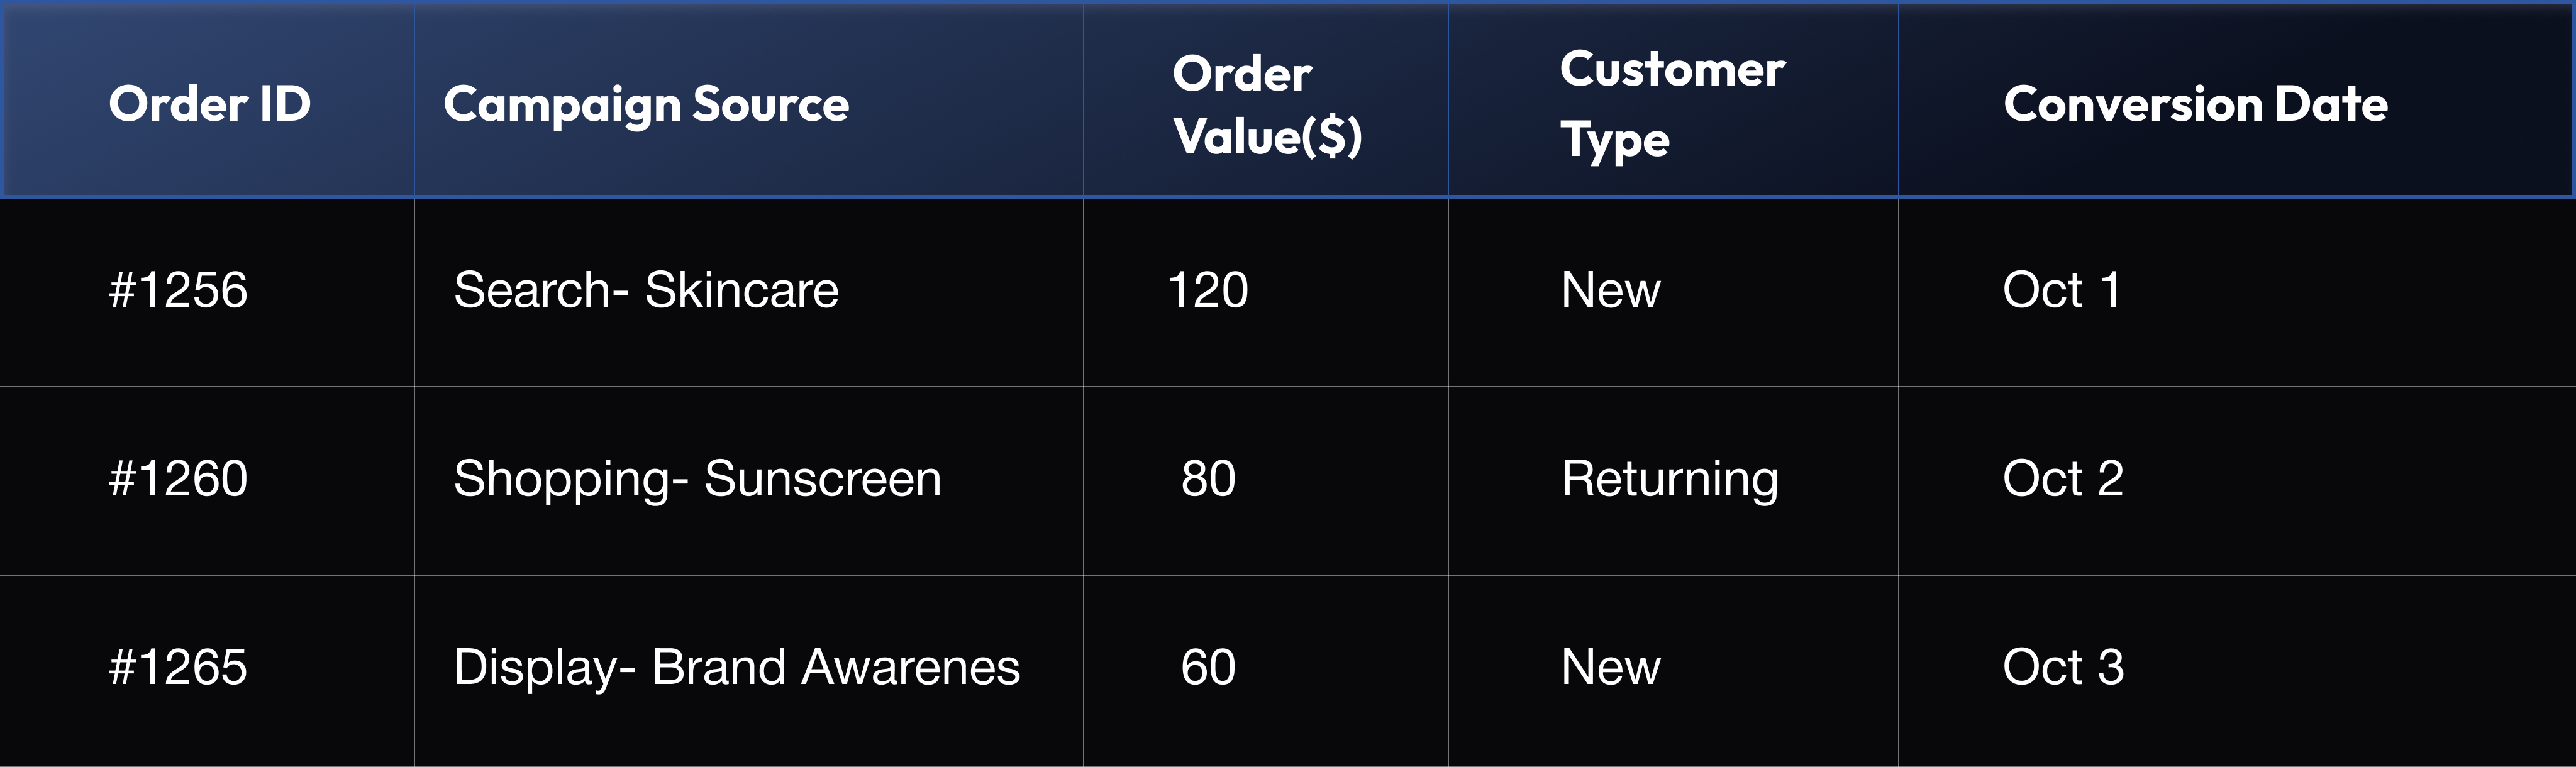
Sales Data Example:
Product Performance Example:
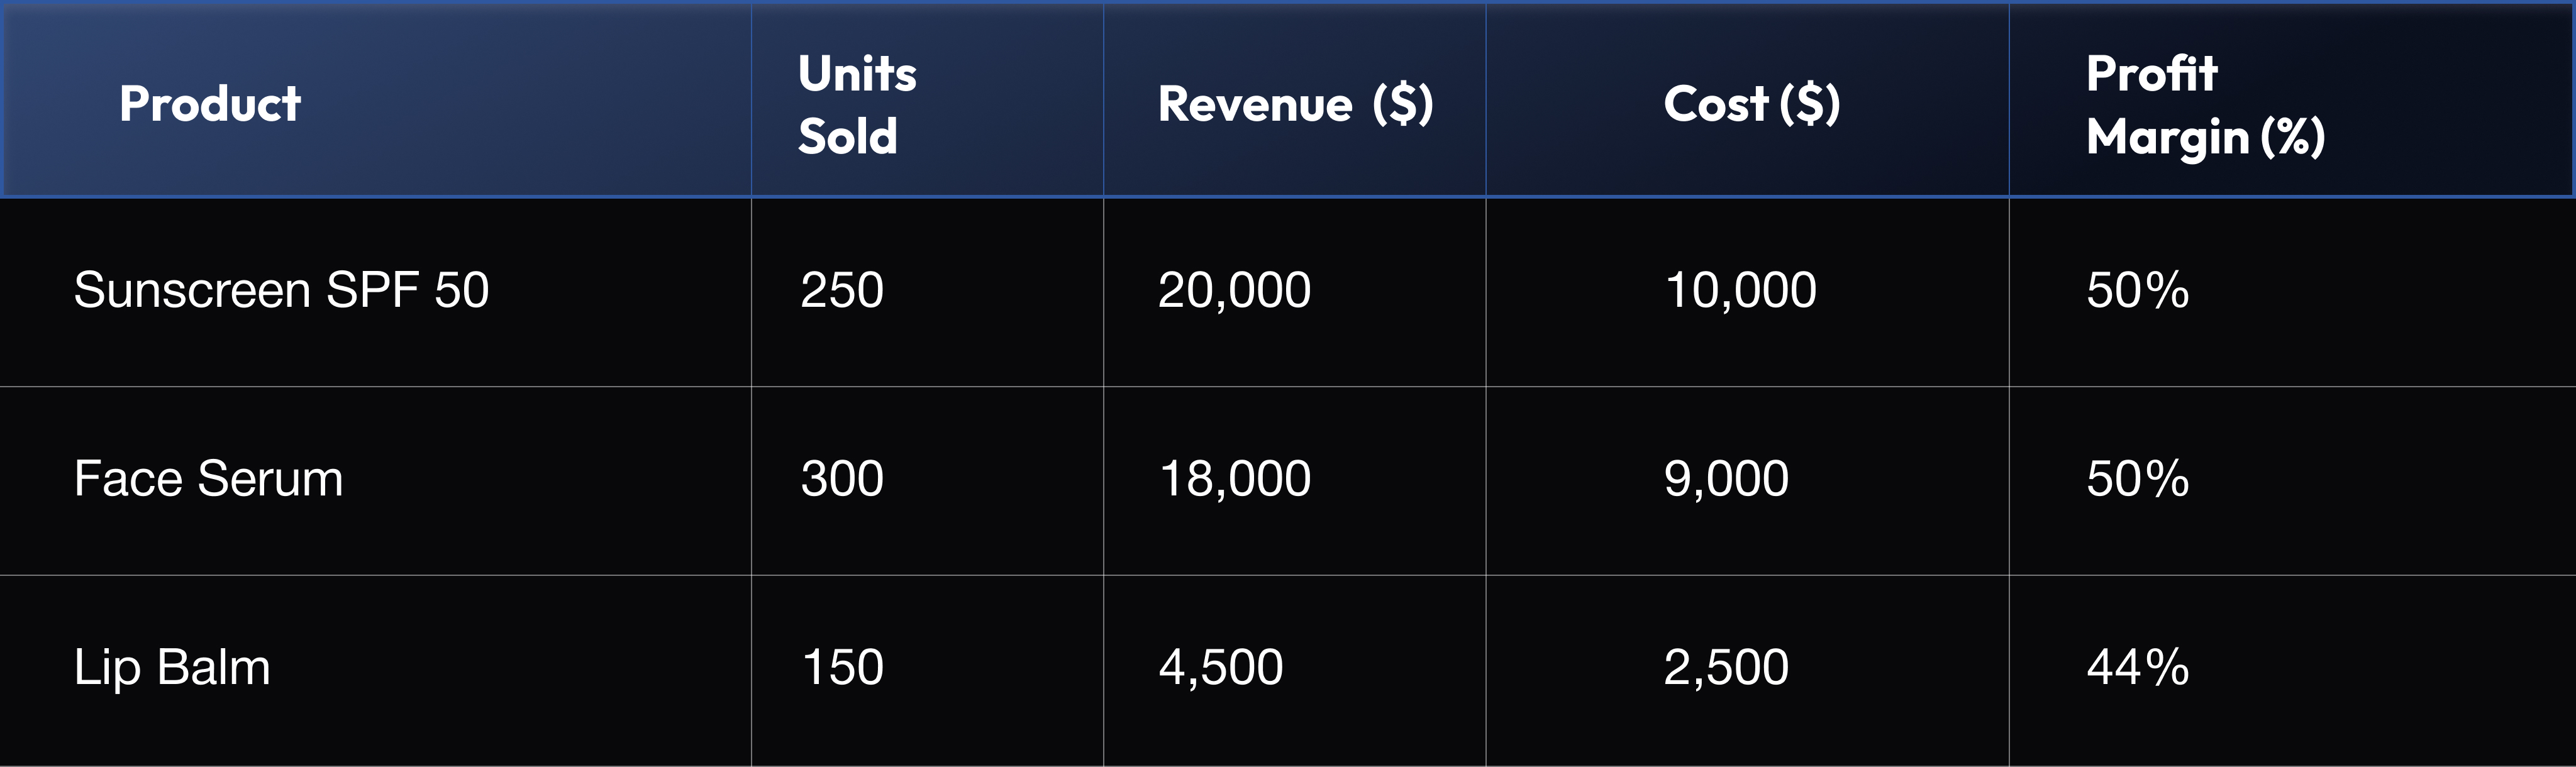
Now imagine correlating these datasets:
When all this data comes together, insights become clear and actionable.
Comparing campaigns shouldn’t be about who gets more clicks. Instead, look at which campaigns generate profitable conversions.
Let’s say your Search campaign has a CTR of 5% and a ROAS of 4.2, while your Display campaign has a CTR of 10% but a ROAS of 1.5. Which one’s better? On paper, Display looks like a winner but in terms of profitability, Search is your real hero.
Here’s a quick way to visualize the comparison:
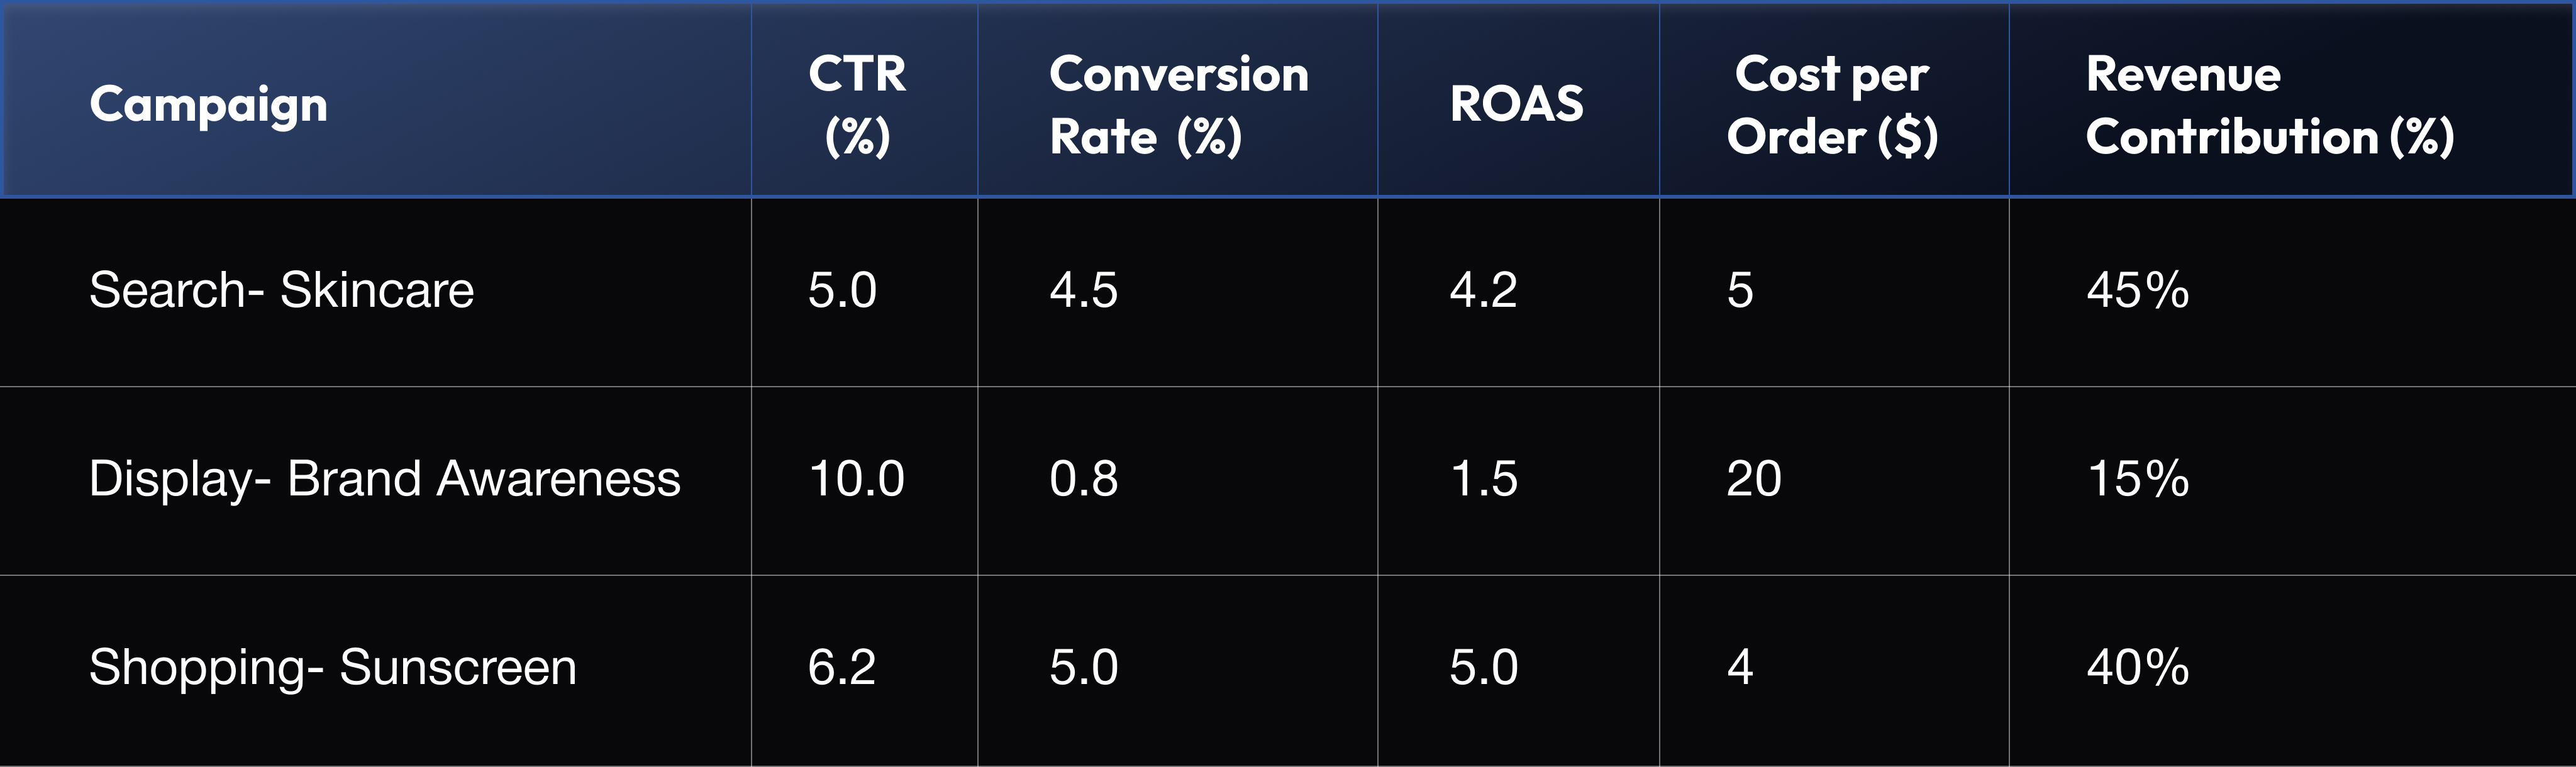
The takeaway: High engagement doesn’t equal high performance. Look for campaigns that do more with less (better ROAS, better margins, better impact).
Google Ads isn’t the only touchpoint in your funnel. Customers discover your brand through SEO, browse products on marketplaces, and finally convert via remarketing ads.
To truly understand performance, you need cross-channel visibility. This is where insightful reporting becomes complex but also the most valuable.
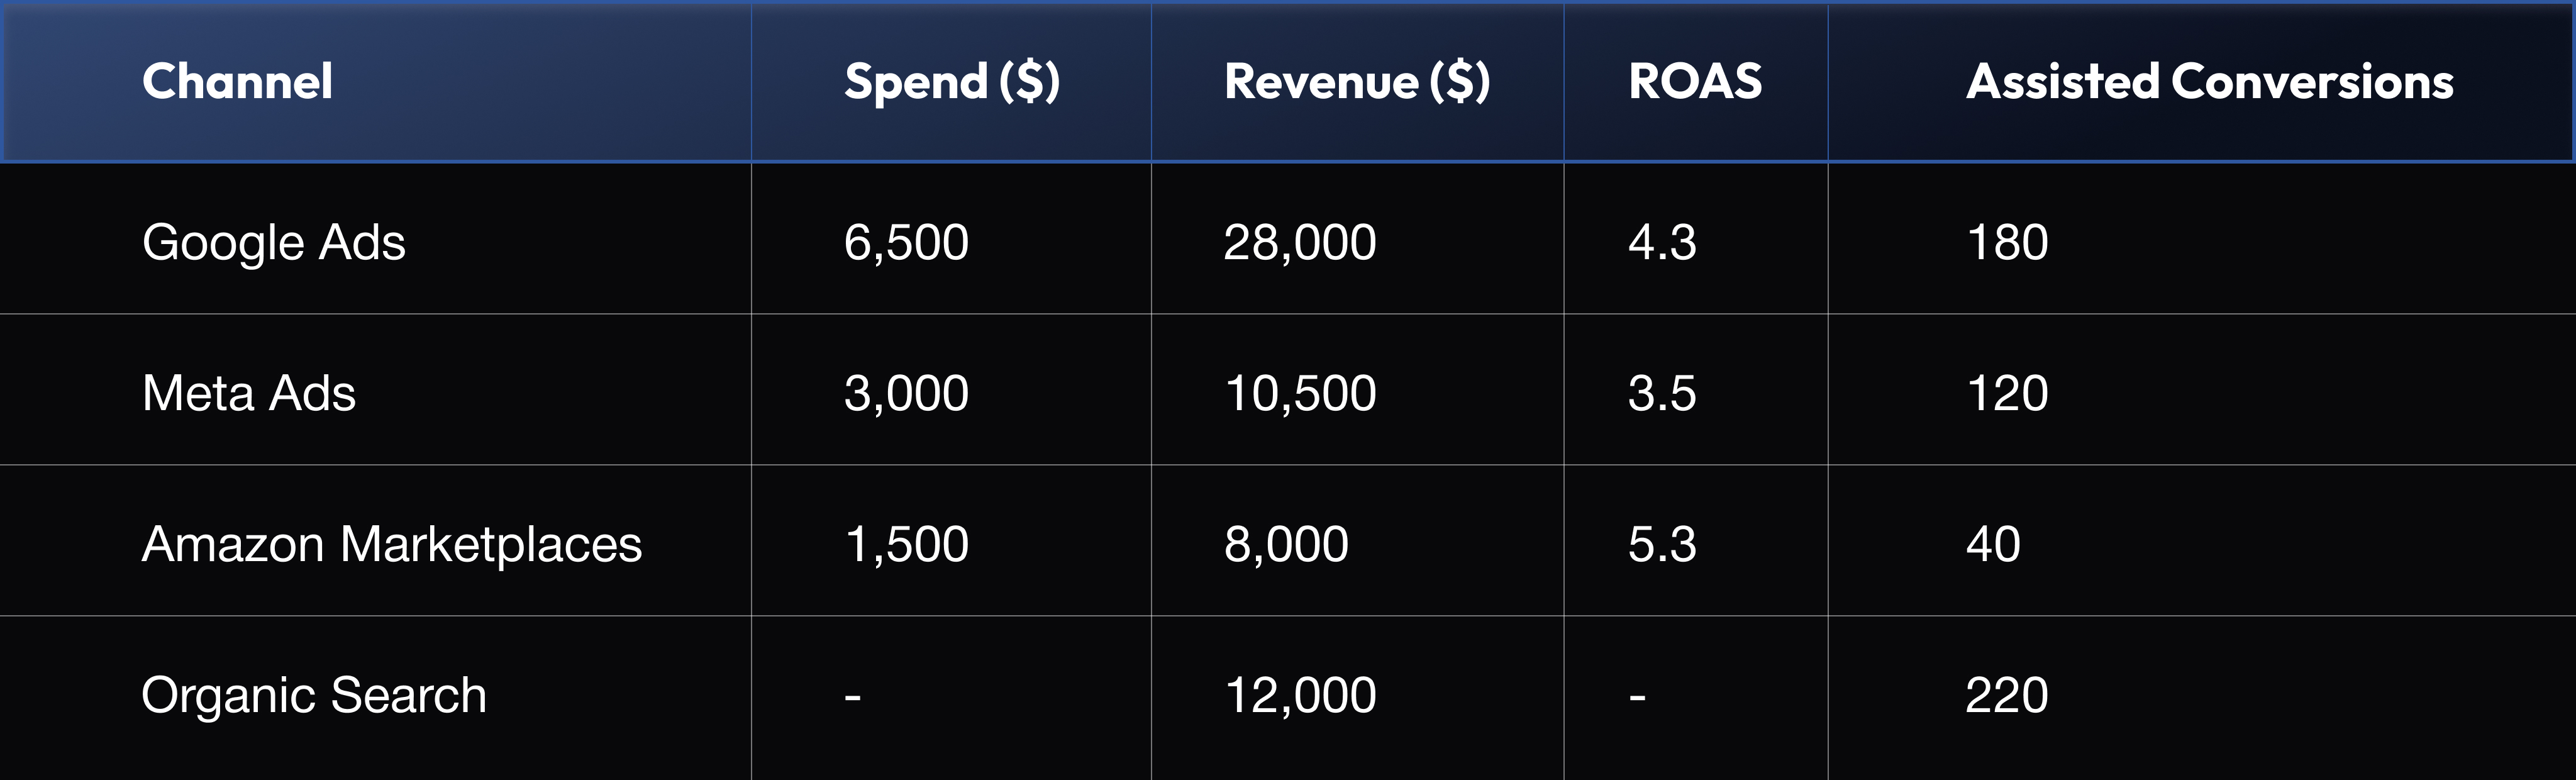
Now you can identify patterns: maybe your Google Ads remarketing campaigns perform better when Meta prospecting ads are active. Or that organic traffic assists most conversions.
Cross-channel analysis helps you understand the true ROI of your digital ecosystem, not just what Google Ads claims in isolation.
Even the most detailed report is useless if it doesn’t lead to action. Insightful reports don’t just say what happened, they suggest what to do next.
Ask these questions in your analysis section:
Then document actionable steps:
By turning insights into strategy, your reports evolve from being static dashboards to growth playbooks - guiding your next move, every week.
In short, insightful reporting is about synthesis, not just numbers. But as you can see, consolidating, cleaning, and analyzing all this data manually can get overwhelming.
In the next section, we’ll show how Graas automates this complexity, transforming scattered ad data into one-click, conversion-driven insights for eCommerce brands.
Creating insightful Google Ads reports manually is time-consuming - juggling spreadsheets, matching order data, and reconciling revenue sources. That’s where Graas comes in. Built specifically for eCommerce, Graas takes your raw ad data and turns it into real business intelligence.
Instead of spending hours compiling reports, you get a clear view of what’s working, what’s not, and why - all in one dashboard.
Here’s how Graas changes the way eCommerce brands analyze and optimize Google Ads performance:
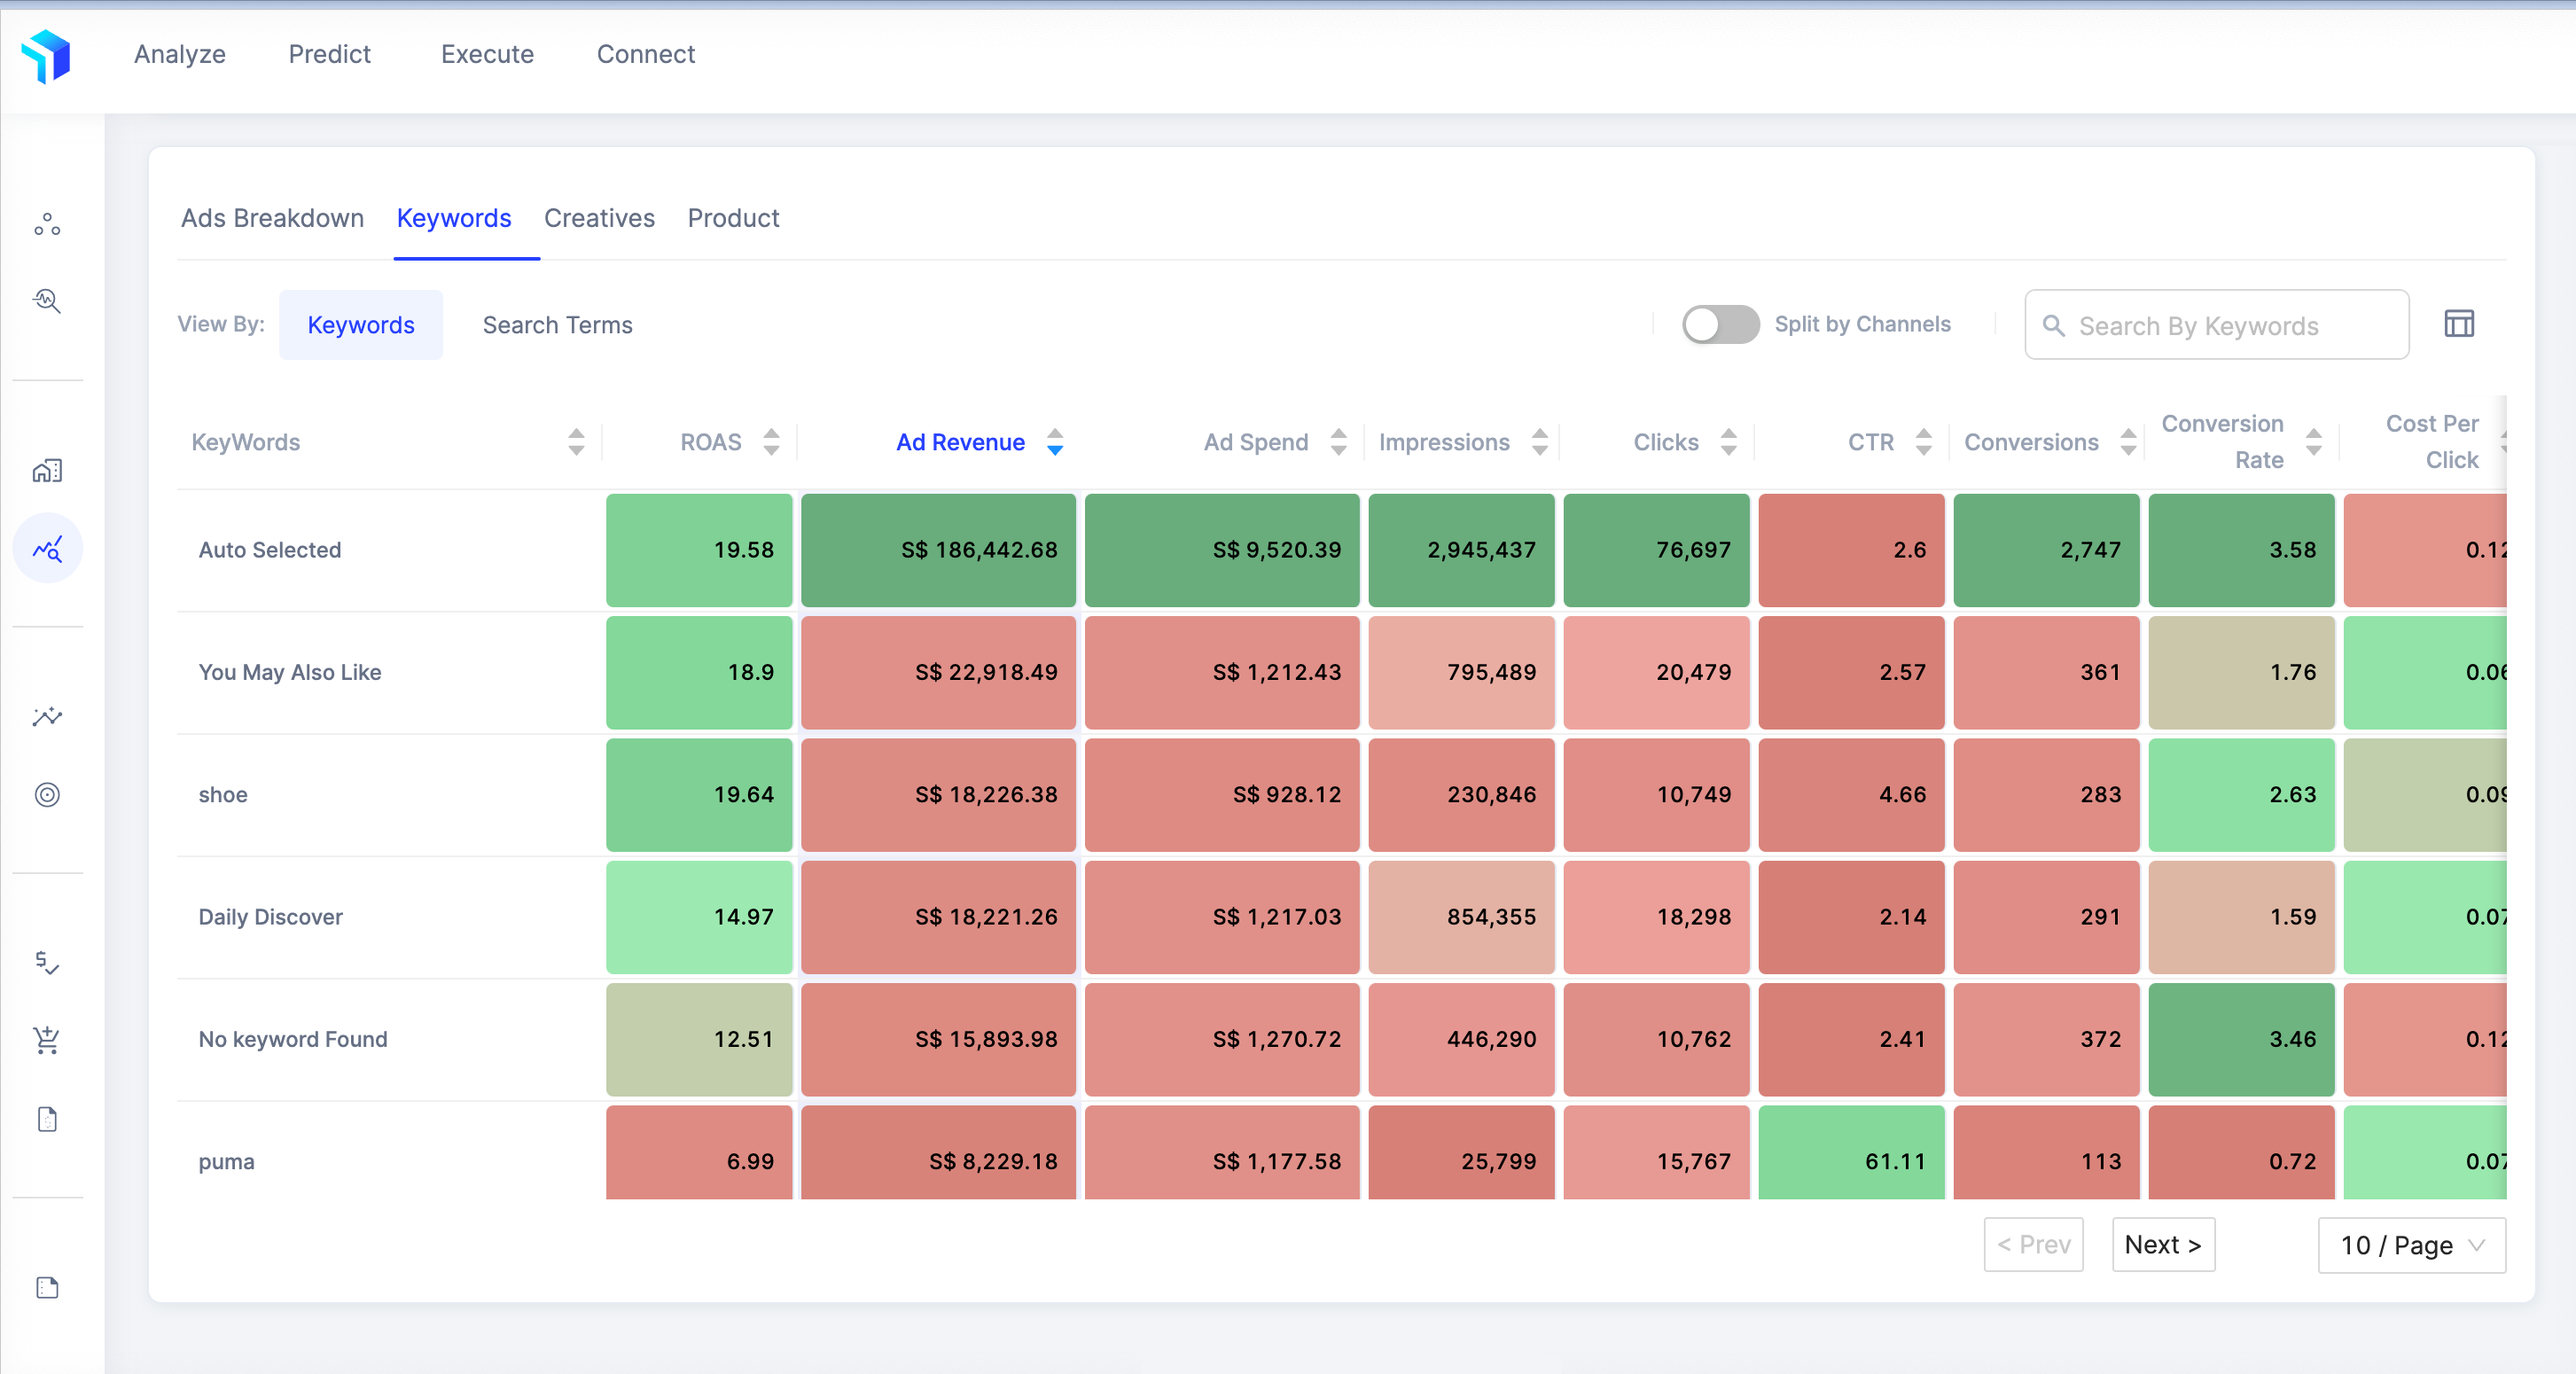
Graas integrates with and pulls data across Search, Display, Shopping, and YouTube into a unified view. No more switching tabs to compare performance. You can instantly see how different ad formats, audiences, and creatives contribute to sales and ROI. Want to know if your lifestyle creatives outperform product-only ads? Or which keyword group drives higher-margin sales? Graas visualizes it all, helping you double down on what converts best.
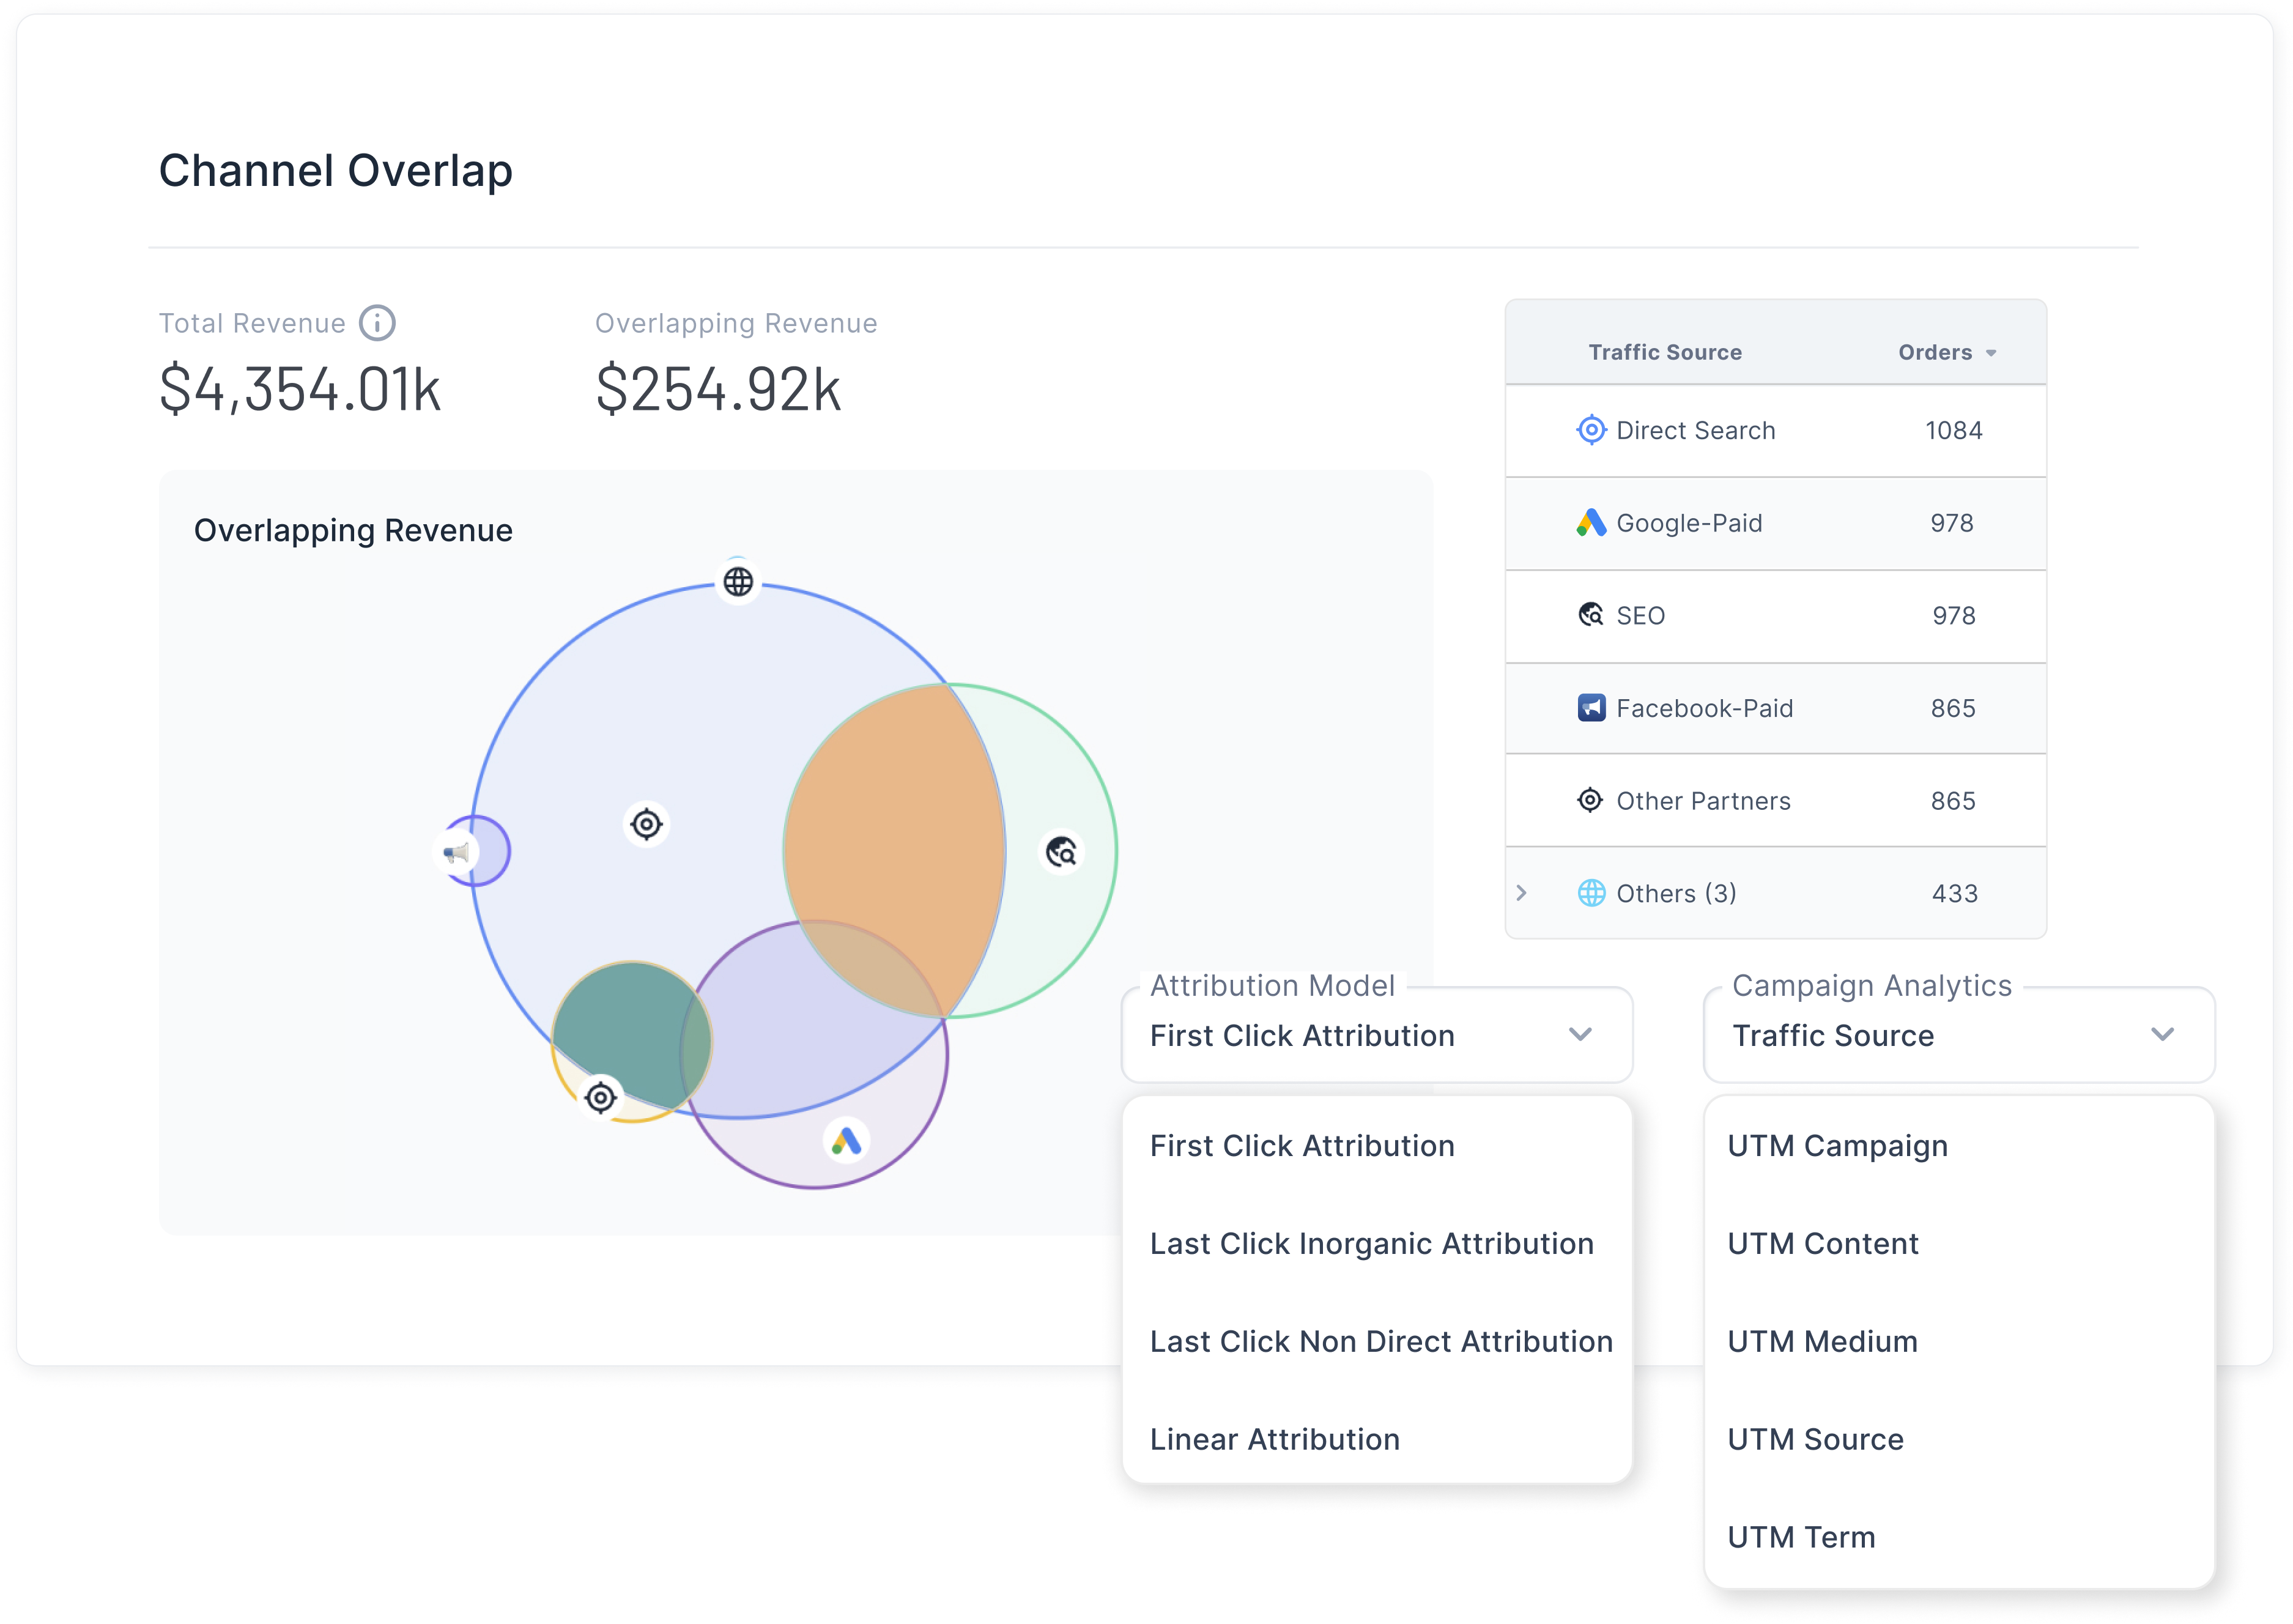
Forget the last-click illusion. Graas offers multi-touch attribution, helping you understand how every campaign and channel influences the buyer journey. You can see how Google Ads, Meta, SEO, and marketplaces work together, identifying the true sales drivers behind each conversion. That means no more overcrediting the final click; instead, you invest in the channels that fuel real growth.
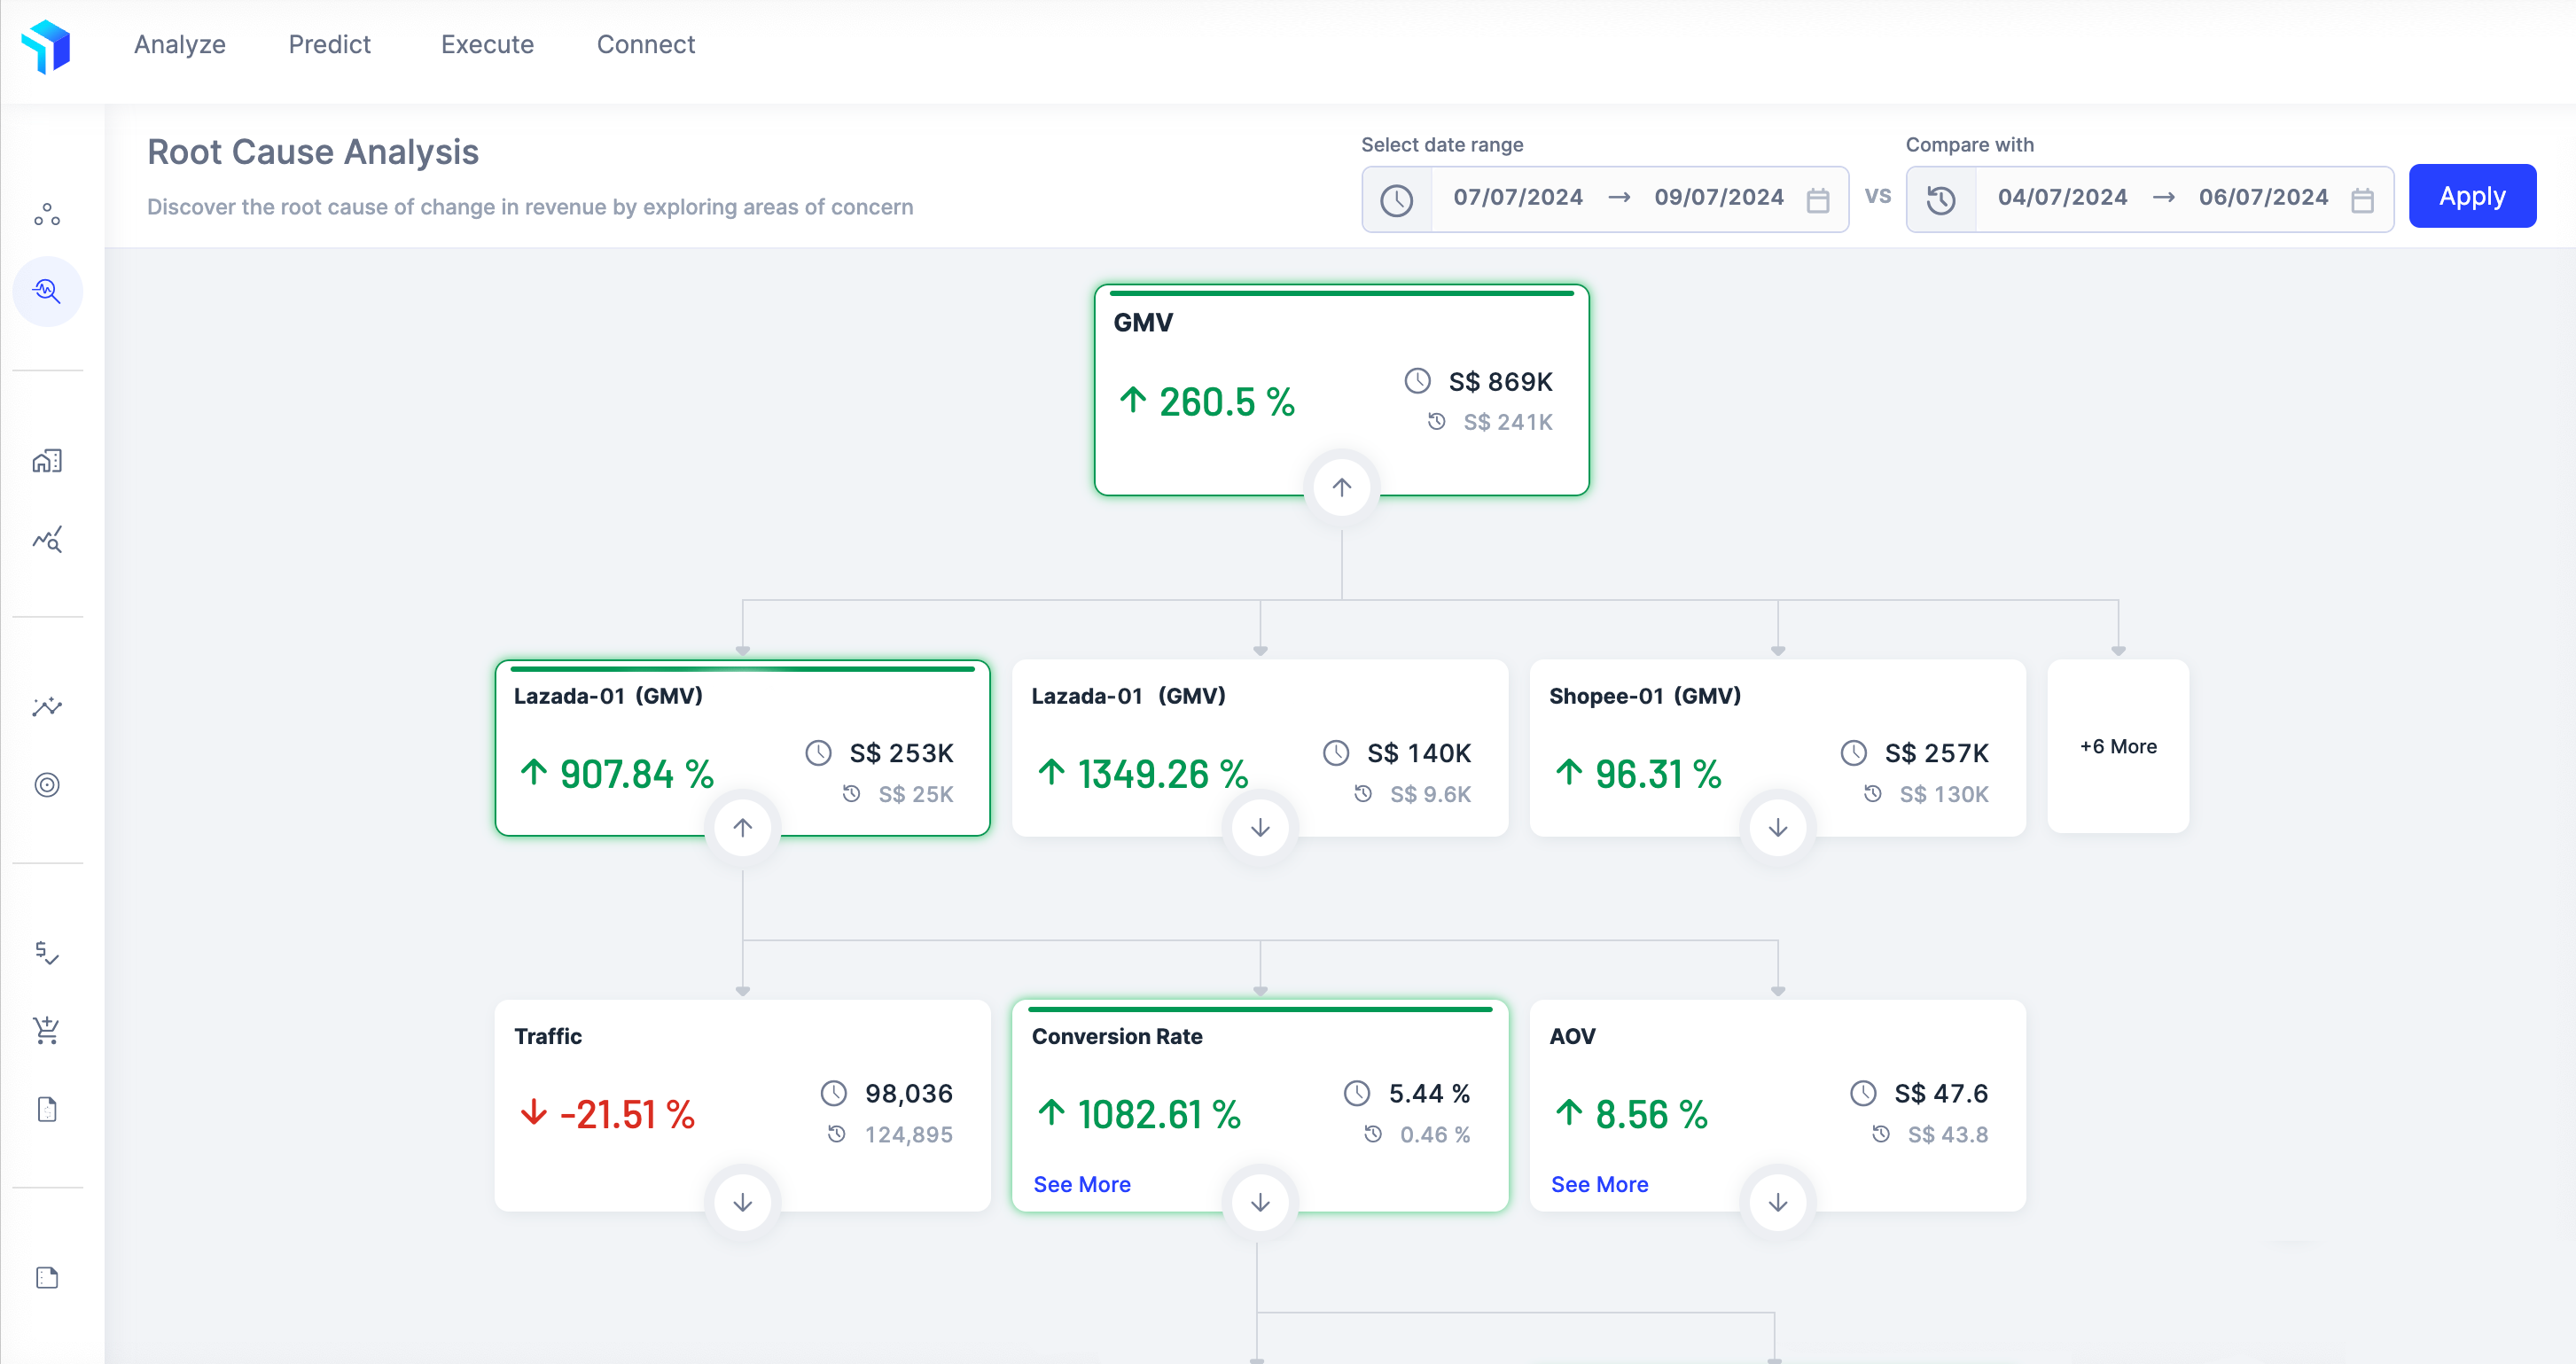
Performance fluctuates, but why? Graas doesn’t just show you dips and spikes; it pinpoints the root causes. Was it a budget shift, a creative change, or seasonality? With automated alerts and granular analysis, you can act fast before small inefficiencies snowball into wasted spend.
With Graas, eCommerce reporting becomes proactive and predictive, transforming data chaos into clear, actionable intelligence.
Ready to stop guessing and start growing? Try Turbo free trial and see how effortless, insightful Google Ads reporting can be!
How to Create Insightful Google Ads Reports for Your eCommerce Brand
Baca artikel
How to Optimize Product Listings in TikTok with Data
Baca artikel
What Most eCommerce Brands Miss in Their Product Performance Data
Baca artikel
Hoppr: Your #1 AI Agent for Instant eCommerce Data Insights
Baca artikel.webp)
5+ AI assistants that will power eCommerce success in 2025
Baca artikelWithout deeper insights, ad spend often turns into wasted spend. In 2022 alone, $5.6 billion of digital ad spend went down the drain, that’s 41% of total digital advertising spend. The culprit? Brands focusing on surface-level metrics like CTR, CPC, and impressions.
While these numbers look good on a dashboard, they don’t tell you what really matters - who’s converting, what’s driving sales, and which campaigns actually move revenue. For eCommerce brands, every click should connect to a purchase, not just a page view.
That’s why creating insightful, conversion-driven Google Ads reports is crucial. It’s not about tracking more data; it’s about tracking the right data. When your reporting goes beyond vanity metrics and digs into performance drivers, you stop guessing and start scaling smarter.
Let’s break down how to build Google Ad reports that reveal true ROI and help you make every ad dollar count.
Most marketers think they’re doing great reporting when they track clicks, impressions, and CTRs. But those metrics only show activity, not impact.
You might be driving tons of traffic, but unless that traffic is converting profitably, you’re flying blind. An insightful Google Ads report doesn’t just tell you what happened, it tells you why it happened and what to do next. That’s where real growth starts.
CTR and CPC tell you how users interact with your ads, but they don’t tell you how those interactions affect your bottom line. Insightful reporting means zooming out from engagement to outcomes like revenue generated, return on ad spend (ROAS), and cost per order (CPO). These metrics directly tie ad performance to profitability, helping you see which campaigns deserve more investment and which are draining budget.
Standard Google Ads dashboards often stop at the click. But a single click rarely tells the whole story in eCommerce. Customers browse, compare, and return later through other channels. That’s why multi-touch attribution is critical - it shows which ads played a real role in the conversion journey. Insightful reports look at assisted conversions, first-click impact, and lifetime value rather than last-click sales alone.
The biggest misconception? Thinking Google Ads alone holds all the answers. In reality, you need to connect your ad data with Shopify, GA4, or CRM data to uncover the full picture. Standard dashboards don’t tell you that your highest CTR campaign might have the lowest profit margin. True insights emerge when you blend performance data with business context, transforming raw numbers into smart decisions that grow revenue sustainably.
Building an insightful Google Ads report is about connecting the dots between marketing effort and business outcome. When done right, your report becomes a decision-making tool, not just a performance recap. Here’s how to create one that truly matters.
Start with why. What’s the real goal behind your ad campaigns? More clicks? Probably not. For eCommerce brands, the goal usually revolves around sales growth, customer acquisition cost (CAC), or revenue efficiency.
When you define goals clearly, your metrics automatically align. For example, if your goal is to increase repeat purchases, focusing solely on ROAS might mislead you. You also need to track Customer Lifetime Value (CLTV) and Repeat Purchase Rate.
When KPIs are business-aligned, reporting shifts from “How did ads perform?” to “How did ads impact growth?”
Here’s where most Google Ads reports fall short. They rely only on ad platform metrics, ignoring the sales and product-side performance that complete the picture.
To make reports insightful, you need to merge multiple data streams - marketing data from Google Ads, sales data from your store, and product profitability data from your backend.
Marketing Data Example:
Sales Data Example:
Product Performance Example:
Now imagine correlating these datasets:
When all this data comes together, insights become clear and actionable.
Comparing campaigns shouldn’t be about who gets more clicks. Instead, look at which campaigns generate profitable conversions.
Let’s say your Search campaign has a CTR of 5% and a ROAS of 4.2, while your Display campaign has a CTR of 10% but a ROAS of 1.5. Which one’s better? On paper, Display looks like a winner but in terms of profitability, Search is your real hero.
Here’s a quick way to visualize the comparison:
The takeaway: High engagement doesn’t equal high performance. Look for campaigns that do more with less (better ROAS, better margins, better impact).
Google Ads isn’t the only touchpoint in your funnel. Customers discover your brand through SEO, browse products on marketplaces, and finally convert via remarketing ads.
To truly understand performance, you need cross-channel visibility. This is where insightful reporting becomes complex but also the most valuable.
Now you can identify patterns: maybe your Google Ads remarketing campaigns perform better when Meta prospecting ads are active. Or that organic traffic assists most conversions.
Cross-channel analysis helps you understand the true ROI of your digital ecosystem, not just what Google Ads claims in isolation.
Even the most detailed report is useless if it doesn’t lead to action. Insightful reports don’t just say what happened, they suggest what to do next.
Ask these questions in your analysis section:
Then document actionable steps:
By turning insights into strategy, your reports evolve from being static dashboards to growth playbooks - guiding your next move, every week.
In short, insightful reporting is about synthesis, not just numbers. But as you can see, consolidating, cleaning, and analyzing all this data manually can get overwhelming.
In the next section, we’ll show how Graas automates this complexity, transforming scattered ad data into one-click, conversion-driven insights for eCommerce brands.
Creating insightful Google Ads reports manually is time-consuming - juggling spreadsheets, matching order data, and reconciling revenue sources. That’s where Graas comes in. Built specifically for eCommerce, Graas takes your raw ad data and turns it into real business intelligence.
Instead of spending hours compiling reports, you get a clear view of what’s working, what’s not, and why - all in one dashboard.
Here’s how Graas changes the way eCommerce brands analyze and optimize Google Ads performance:
Graas integrates with and pulls data across Search, Display, Shopping, and YouTube into a unified view. No more switching tabs to compare performance. You can instantly see how different ad formats, audiences, and creatives contribute to sales and ROI. Want to know if your lifestyle creatives outperform product-only ads? Or which keyword group drives higher-margin sales? Graas visualizes it all, helping you double down on what converts best.
Forget the last-click illusion. Graas offers multi-touch attribution, helping you understand how every campaign and channel influences the buyer journey. You can see how Google Ads, Meta, SEO, and marketplaces work together, identifying the true sales drivers behind each conversion. That means no more overcrediting the final click; instead, you invest in the channels that fuel real growth.
Performance fluctuates, but why? Graas doesn’t just show you dips and spikes; it pinpoints the root causes. Was it a budget shift, a creative change, or seasonality? With automated alerts and granular analysis, you can act fast before small inefficiencies snowball into wasted spend.
With Graas, eCommerce reporting becomes proactive and predictive, transforming data chaos into clear, actionable intelligence.
Ready to stop guessing and start growing? Try Turbo free trial and see how effortless, insightful Google Ads reporting can be!
8 Craig Road, Singapore 089668
Email: info@graas.ai
Follow kami di LinkedIn