

Festive sales in Southeast Asia move fast, and CNY and Ramadan are the clearest proof of that.
Chinese New Year alone can drive 30 to 40 percent of annual gift category revenue in just two weeks. Ramadan is even more intense, with fashion and F&B brands seeing over a 50 percent spike in the final ten days before Eid.
Because these windows are so compressed, delayed reporting often means missed opportunities. At the same time, SEA shoppers rarely stick to one platform. They compare prices, offers, and availability across Shopify, Lazada, Shopee, and TikTok Shop before buying. That makes single-channel analysis incomplete and sometimes misleading.
In this blog, we break down why analyzing CNY and Ramadan performance is uniquely challenging, and how the right AI prompts can help you uncover deeper, more actionable insights while the season is still live.
It’s essential to understand why it’s difficult to make the right decision when you sit to analyze the data.
Unlike evergreen sales periods, CNY and Ramadan compress massive demand into a few days. Revenue can spike or drop sharply overnight based on paydays, campaign launches, or stock availability.
Looking at weekly or even daily averages smooths out these swings and hides what actually moved the needle. What teams need to track is change velocity. Which day demand accelerated, when it stalled, and how quickly it recovered.
Without this, decisions are based on totals rather than momentum, which is risky in a window that may last only ten to fourteen days.
CNY does not fall on the same dates each year and can move anywhere between 21 to 51 days. Ramadan shifts even more predictably but just as disruptively, moving backward by roughly 10 to 12 days every year.
A straight YoY comparison by calendar date often compares different buying contexts. Payday cycles, school schedules, and even weather can be completely misaligned.
Without normalizing performance by festival-relative days, like Day -10 to Day +3, teams end up drawing the wrong conclusions about growth or decline.
CNY shoppers tend to front-load purchases, with gifting and travel buys peaking well before the festival day. Ramadan behaves very differently. Demand builds in waves, with early-month stocking, mid-month replenishment, and a sharp final surge before Eid.
Standard week-over-week or month-over-month metrics assume linear behavior. They fail to capture these cultural rhythms and often flag false positives or negatives in performance.
During festive periods, brands rarely run a single campaign in isolation. Flash sales, live streams, influencer drops, and marketplace-wide promotions often overlap. When Shopify, Shopee, Lazada, and TikTok Shop all spike at once, attribution becomes murky.
It is difficult to tell whether growth came from pricing, visibility, creator-led traffic, or pure seasonal intent. Without cross-channel context, performance analysis becomes fragmented and misleading.
During CNY and Raya or Ramadan, performance shifts so quickly that teams often move from dashboards to questions. The most common ones look like this:
Traditional BI workflows are not built for festivals like CNY or Ramadan. Custom reports often take two to three days to build, review, and share. In a fourteen-day CNY window, that delay alone can cost 15 to 20 percent of the selling period.
By the time insights arrive, shopper behavior may have already shifted. AI prompts reduce this latency by letting teams query performance in real time and react while demand is still active.
Seasonal decisions are usually driven by marketing, growth, and category teams, not data analysts. Yet most insights still depend on SQL queries or pre-built dashboards. AI prompts remove that dependency. A marketing manager can ask a plain-language question and get an immediate answer, without waiting in a reporting queue or interpreting complex charts.
AI prompts change how teams work during peak sales periods.
Below are practical prompts and sample datasets for each, which you can use during live festive windows. Each category focuses on decisions that affect revenue.
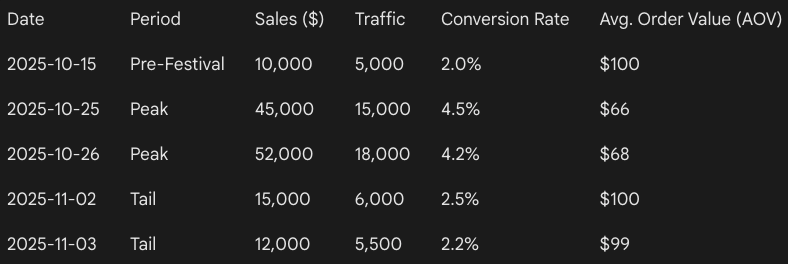
Compare day-level sales performance across the pre-festival, peak, and tail periods. Identify exactly when demand accelerated or decelerated and explain whether changes were driven by traffic quality, conversion behavior, or order value rather than overall volume.
Identify days with statistically abnormal spikes or drops in revenue or orders. For each anomaly, explain the most likely operational, promotional, or behavioral drivers instead of listing raw variance.

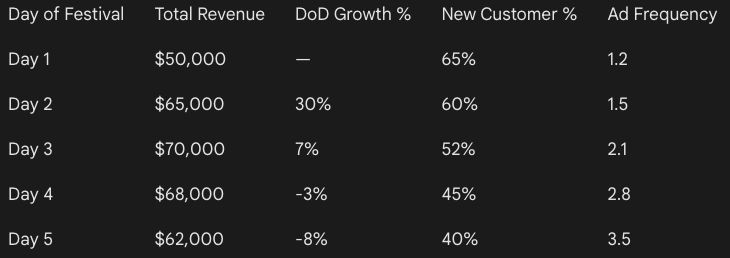
Analyze day-over-day momentum throughout the festival window and identify the point where demand showed signs of fatigue or saturation. Indicate whether the slowdown was structural or campaign-driven.
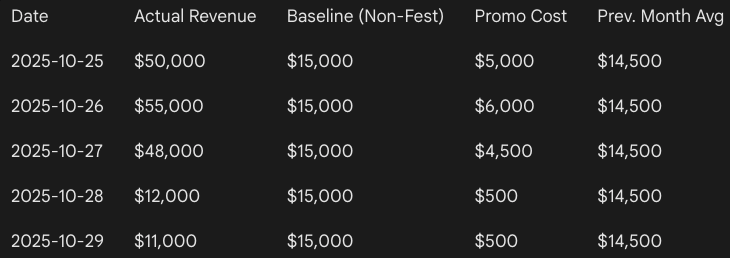
Separate baseline demand from festival-driven demand by comparing performance against a normalized non-festival period. Quantify how much revenue was genuinely incremental versus pulled forward.
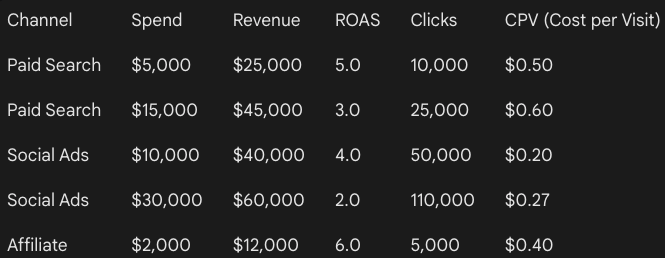
Analyze how the revenue and order mix across DTC, marketplaces, and social commerce changed during peak festival days. Explain what these shifts reveal about shopper intent and price sensitivity.

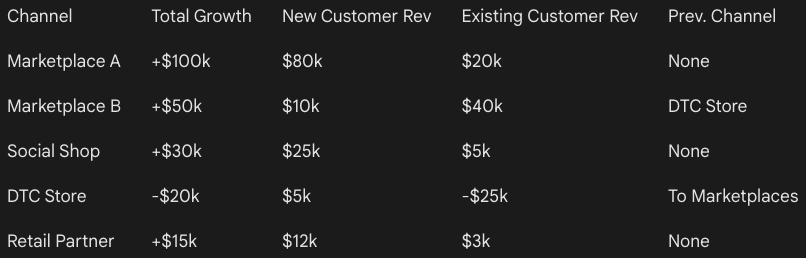
Determine which channels generated net new demand during the festival and which primarily redistributed demand from other channels. Highlight where growth was additive and where it was cannibalistic.
Evaluate how channel efficiency changed as volume scaled. Identify channels where higher spend or visibility led to diminishing returns during peak days.
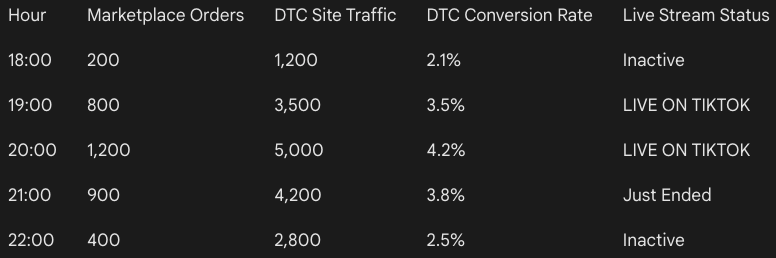
Analyze whether spikes on marketplaces or live commerce platforms led to downstream conversion lifts on the brand store, and estimate the halo effect window.
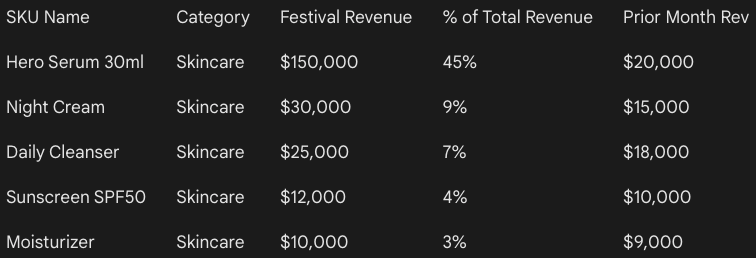
Identify which SKUs or categories accounted for a disproportionate share of festival growth. Assess whether performance was diversified or overly dependent on a small set of products.
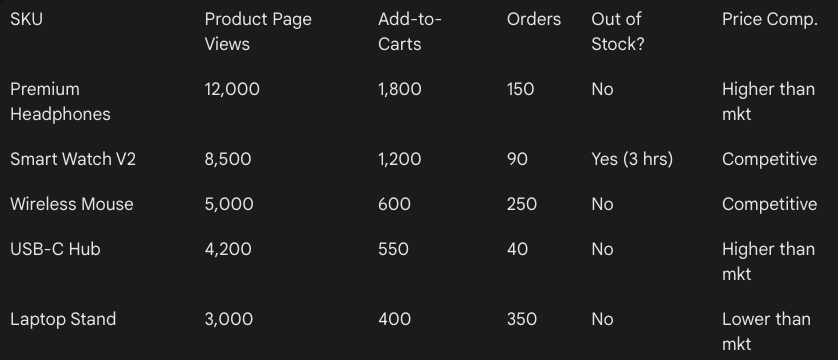
Surface SKUs and categories with strong traffic or add-to-cart growth but weak conversion during peak hours. Diagnose whether friction came from pricing, fulfillment constraints, or competitive pressure.
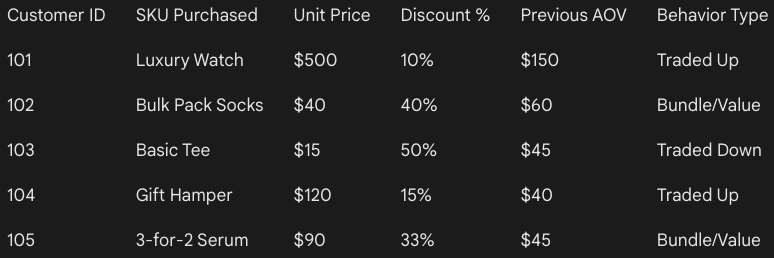
Analyze whether customers traded up, traded down, or shifted to bundles during the festival. Highlight how discount depth and urgency influenced SKU selection.
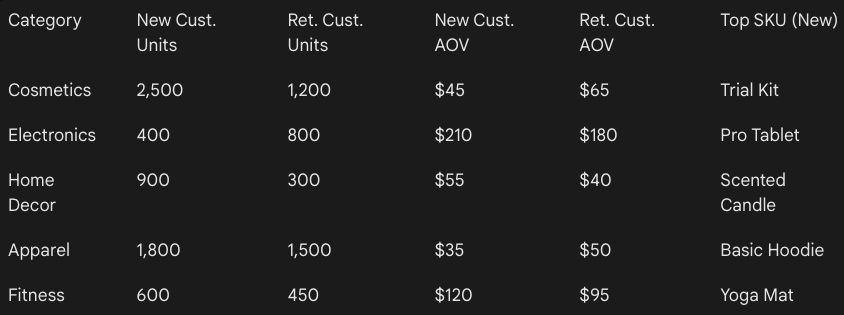
Compare purchasing patterns between new and returning customers at the SKU and category level. Identify which products drove acquisition versus retention.
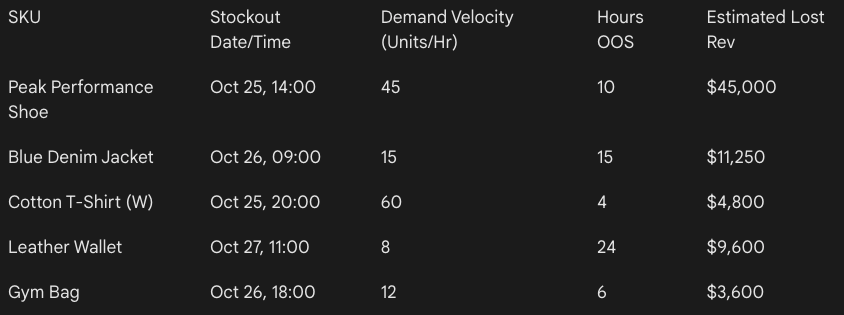
Identify products that stocked out during high-demand periods and estimate unrealized revenue based on demand velocity at the time of stockout.
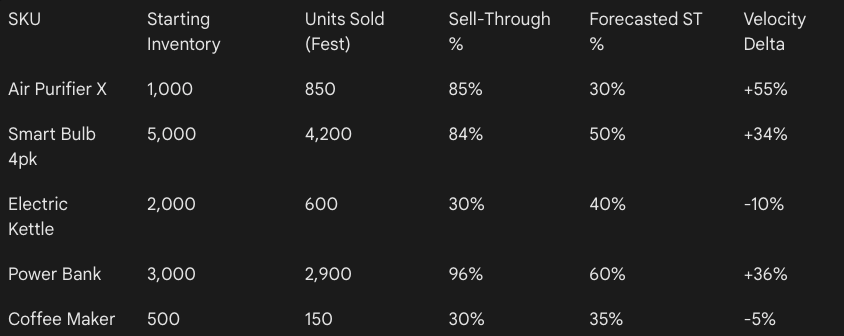
Compare sell-through velocity before and during the festival to identify products that outpaced replenishment assumptions.
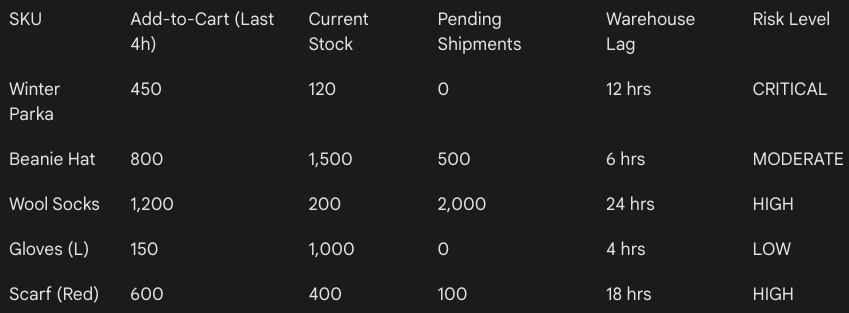
Detect early signals of impending stock stress, such as rising add-to-cart rates combined with slowing fulfillment or shrinking available inventory.
Identify products with elevated inventory risk after the festival ends and recommend corrective actions such as markdowns, channel shifts, or bundle strategies.
AI prompts are powerful for speed and exploration. They help teams run quick comparisons, spot early performance signals, and surface patterns that would otherwise take days to uncover.
However, prompts have limits. They rarely explain true cross-channel causality or why performance changed beyond correlations. Under pressure, interpretations can also become inconsistent across teams. Prompts struggle with deeper questions around segment interdependencies, promotional incrementality, and what demand was genuinely pulled forward. They also offer limited clarity on post-festival retention and long-term customer value unless paired with structured models and historical context.
To tackle this, you need something that has a historical context of your brand - because if you upload a large dataset on LLMs, there’s always a risk of hallucination.
During CNY and Raya or Ramadan, teams ask more questions in less time. Dashboards and charts can slow decision-making when interpretation takes longer than the window allows. What teams really need are clear answers, not more visualizations to decode.
Graas’ Hoppr is built for this exact problem. It works on unified eCommerce data across channels and is grounded in your brand’s historical performance, so insights are always contextual.
Apart from showing what moved, Hoppr explains what changed and what actually drove the change. With CNY and Ramadan 2026 beginning on February 17, teams that wait until mid-campaign to understand performance will spend half their peak window reacting instead of optimizing. Speed matters.
See how hoppr helps teams understand what changed during CNY and Raya or Ramadan sales!

WhatsApp Chatbots vs AI Sales Agents: Which Drives Higher Conversions for eCommerce Brands?
Baca artikel
How brands use WhatsApp for eCommerce in SEA: The role of AI agents in driving conversions
Baca artikel
Dari Browsing Menjadi Chat: Alasan Percakapan Mendorong eCommerce
Baca artikel
ROI dari Sentralisasi Operasional Marketplace dengan Turbo
Baca artikel
Cara Brand Enterprise Mengelola Inventory di Shopee, Lazada, dan TikTok Shop
Baca artikelFestive sales in Southeast Asia move fast, and CNY and Ramadan are the clearest proof of that.
Chinese New Year alone can drive 30 to 40 percent of annual gift category revenue in just two weeks. Ramadan is even more intense, with fashion and F&B brands seeing over a 50 percent spike in the final ten days before Eid.
Because these windows are so compressed, delayed reporting often means missed opportunities. At the same time, SEA shoppers rarely stick to one platform. They compare prices, offers, and availability across Shopify, Lazada, Shopee, and TikTok Shop before buying. That makes single-channel analysis incomplete and sometimes misleading.
In this blog, we break down why analyzing CNY and Ramadan performance is uniquely challenging, and how the right AI prompts can help you uncover deeper, more actionable insights while the season is still live.
It’s essential to understand why it’s difficult to make the right decision when you sit to analyze the data.
Unlike evergreen sales periods, CNY and Ramadan compress massive demand into a few days. Revenue can spike or drop sharply overnight based on paydays, campaign launches, or stock availability.
Looking at weekly or even daily averages smooths out these swings and hides what actually moved the needle. What teams need to track is change velocity. Which day demand accelerated, when it stalled, and how quickly it recovered.
Without this, decisions are based on totals rather than momentum, which is risky in a window that may last only ten to fourteen days.
CNY does not fall on the same dates each year and can move anywhere between 21 to 51 days. Ramadan shifts even more predictably but just as disruptively, moving backward by roughly 10 to 12 days every year.
A straight YoY comparison by calendar date often compares different buying contexts. Payday cycles, school schedules, and even weather can be completely misaligned.
Without normalizing performance by festival-relative days, like Day -10 to Day +3, teams end up drawing the wrong conclusions about growth or decline.
CNY shoppers tend to front-load purchases, with gifting and travel buys peaking well before the festival day. Ramadan behaves very differently. Demand builds in waves, with early-month stocking, mid-month replenishment, and a sharp final surge before Eid.
Standard week-over-week or month-over-month metrics assume linear behavior. They fail to capture these cultural rhythms and often flag false positives or negatives in performance.
During festive periods, brands rarely run a single campaign in isolation. Flash sales, live streams, influencer drops, and marketplace-wide promotions often overlap. When Shopify, Shopee, Lazada, and TikTok Shop all spike at once, attribution becomes murky.
It is difficult to tell whether growth came from pricing, visibility, creator-led traffic, or pure seasonal intent. Without cross-channel context, performance analysis becomes fragmented and misleading.
During CNY and Raya or Ramadan, performance shifts so quickly that teams often move from dashboards to questions. The most common ones look like this:
Traditional BI workflows are not built for festivals like CNY or Ramadan. Custom reports often take two to three days to build, review, and share. In a fourteen-day CNY window, that delay alone can cost 15 to 20 percent of the selling period.
By the time insights arrive, shopper behavior may have already shifted. AI prompts reduce this latency by letting teams query performance in real time and react while demand is still active.
Seasonal decisions are usually driven by marketing, growth, and category teams, not data analysts. Yet most insights still depend on SQL queries or pre-built dashboards. AI prompts remove that dependency. A marketing manager can ask a plain-language question and get an immediate answer, without waiting in a reporting queue or interpreting complex charts.
AI prompts change how teams work during peak sales periods.
Below are practical prompts and sample datasets for each, which you can use during live festive windows. Each category focuses on decisions that affect revenue.
Compare day-level sales performance across the pre-festival, peak, and tail periods. Identify exactly when demand accelerated or decelerated and explain whether changes were driven by traffic quality, conversion behavior, or order value rather than overall volume.
Identify days with statistically abnormal spikes or drops in revenue or orders. For each anomaly, explain the most likely operational, promotional, or behavioral drivers instead of listing raw variance.
Analyze day-over-day momentum throughout the festival window and identify the point where demand showed signs of fatigue or saturation. Indicate whether the slowdown was structural or campaign-driven.
Separate baseline demand from festival-driven demand by comparing performance against a normalized non-festival period. Quantify how much revenue was genuinely incremental versus pulled forward.
Analyze how the revenue and order mix across DTC, marketplaces, and social commerce changed during peak festival days. Explain what these shifts reveal about shopper intent and price sensitivity.
Determine which channels generated net new demand during the festival and which primarily redistributed demand from other channels. Highlight where growth was additive and where it was cannibalistic.
Evaluate how channel efficiency changed as volume scaled. Identify channels where higher spend or visibility led to diminishing returns during peak days.
Analyze whether spikes on marketplaces or live commerce platforms led to downstream conversion lifts on the brand store, and estimate the halo effect window.
Identify which SKUs or categories accounted for a disproportionate share of festival growth. Assess whether performance was diversified or overly dependent on a small set of products.
Surface SKUs and categories with strong traffic or add-to-cart growth but weak conversion during peak hours. Diagnose whether friction came from pricing, fulfillment constraints, or competitive pressure.
Analyze whether customers traded up, traded down, or shifted to bundles during the festival. Highlight how discount depth and urgency influenced SKU selection.
Compare purchasing patterns between new and returning customers at the SKU and category level. Identify which products drove acquisition versus retention.
Identify products that stocked out during high-demand periods and estimate unrealized revenue based on demand velocity at the time of stockout.
Compare sell-through velocity before and during the festival to identify products that outpaced replenishment assumptions.
Detect early signals of impending stock stress, such as rising add-to-cart rates combined with slowing fulfillment or shrinking available inventory.
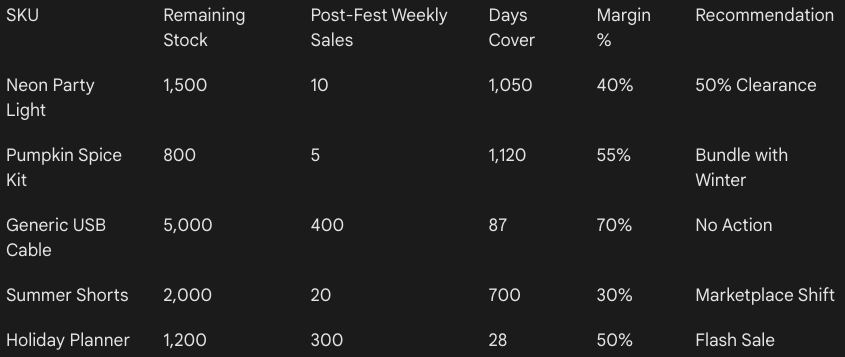
Identify products with elevated inventory risk after the festival ends and recommend corrective actions such as markdowns, channel shifts, or bundle strategies.
AI prompts are powerful for speed and exploration. They help teams run quick comparisons, spot early performance signals, and surface patterns that would otherwise take days to uncover.
However, prompts have limits. They rarely explain true cross-channel causality or why performance changed beyond correlations. Under pressure, interpretations can also become inconsistent across teams. Prompts struggle with deeper questions around segment interdependencies, promotional incrementality, and what demand was genuinely pulled forward. They also offer limited clarity on post-festival retention and long-term customer value unless paired with structured models and historical context.
To tackle this, you need something that has a historical context of your brand - because if you upload a large dataset on LLMs, there’s always a risk of hallucination.
During CNY and Raya or Ramadan, teams ask more questions in less time. Dashboards and charts can slow decision-making when interpretation takes longer than the window allows. What teams really need are clear answers, not more visualizations to decode.
Graas’ Hoppr is built for this exact problem. It works on unified eCommerce data across channels and is grounded in your brand’s historical performance, so insights are always contextual.
Apart from showing what moved, Hoppr explains what changed and what actually drove the change. With CNY and Ramadan 2026 beginning on February 17, teams that wait until mid-campaign to understand performance will spend half their peak window reacting instead of optimizing. Speed matters.
See how hoppr helps teams understand what changed during CNY and Raya or Ramadan sales!
8 Craig Road, Singapore 089668
Email: info@graas.ai
Follow kami di LinkedIn