

Challenges in eCommerce are plenty. They can hit you in multiple ways, like supply chain disruptions or website crashes, with the potential to negatively impact operations and profits.
While implementing quick band-aid solutions, it is easy to fix the symptoms. But it's temporary; the underlying issue stays. To truly fix the core issue and prevent it from happening in the future, eCommerce business owners must find out the root cause.
In this blog, we'll discuss what root cause analysis is in eCommerce. We’ll also provide you with a way to run the root cause analysis for your eCommerce brand to find out why your business is underperforming.
What is root cause analysis in eCommerce?
The biggest challenge for eCommerce businesses to do RCA
How can eCommerce brands conduct root cause analysis with Graas?
Fix the root cause issues with Graas
Whenever you launch a new product or run a campaign, there are expectations around the revenue and profit they will generate. But if the results are not what you expected, it's very human to ask, "Why did this happen?"
Root cause analysis is mainly the process of tracing a problem back to its origin to find the answer to this question. It helps you understand the real reasons why the issues are occurring so you can solve them more effectively.
Once you know the root cause of a problem, you can take preventative steps to stop it from happening again. This allows eCommerce businesses to implement long-lasting solutions rather than temporary quick fixes.
For example, if an eCommerce site experiences a decrease in conversion rate, a root cause analysis would fix the core reason why the conversions are going down instead of just offering more discounts each time.
Root cause analysis is not as easy as it sounds. E-commerce brands and merchants market and sell their products across multiple online platforms. So, data is scattered across different channels. The way they collect, store and process this data can have a big impact on the outcomes. To begin with, data is not homogenous. It comes in various forms, some of which are structured like tables, while others, such as PDF reports, are not. The key is to create structured information from multiple heterogeneous factors. Additionally, the process of extracting and analyzing data is time-consuming, labor-intensive, and prone to human errors. Lastly, data can quickly become outdated, and not having access to real-time information, or worse, relying on outdated data, can lead to disastrous decision-making.
This is where Graas comes in. Graas aggregates data from all the e-commerce marketplaces and channels where you sell, including your own website. This provides you with integrated data from each platform in one centralized place. And when you have this holistic view, you can finally connect the dots between issues across touchpoints to uncover root causes.
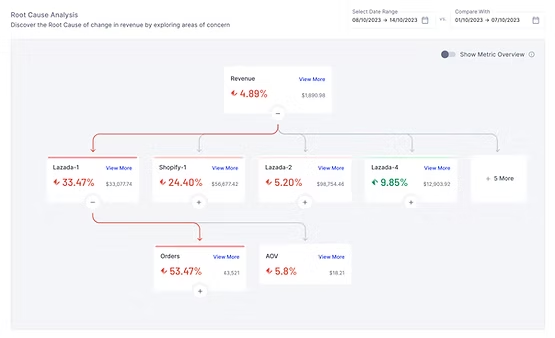
Root Cause Analytics is one of the key features of Graas, which helps you diagnose the revenue of your eCommerce brand. It helps you analyze the relationship between the metrics influencing your revenue to identify the primary drivers behind the fluctuations.
When Revenue Diagnostics is run for a selected time period, the key factors contributing to the changes in GMV are identified. The factors with the maximum impact are further analyzed in to navigate toward root cause. The channel with the maximum impact is highlighted at the top.
For each channel, the three core eCommerce metrics are displayed: Traffic, Conversion, and Average Order Value (AOV). These metrics combined form the eCommerce equation which gives you a roadmap to work on your revenue generation.
Traffic is measured as either "total number of page visits" or "number of unique visitors" to all the product pages of your store in a given time period.Declining traffic could indicate many issues like website crashes, search visibility declines, or reduced marketing efforts.
With Graas, you can view detailed traffic data across channels and marketing sources. Check if lower traffic is widespread or limited to specific channels. This helps narrow down the problem.
For example, if traffic drops are limited to your website, the reason can be technical errors that do not allow the visitor to access your store. One of the solutions could be IT troubleshooting and web performance fixes.
But if overall visits are down across channels, ineffective marketing campaigns are likely to be blamed. You can keep drilling down to understand the reason for the dip. Is it onsite or offsite ads, impressions or clicks, specific campaigns or products? By tracing it down to the lowest possible level, you can identify and fix the cause of the issue..
Granular traffic analytics in Graas allows you to pinpoint weak points in customer reach and acquisition. Addressing downward trends here can reopen the top of the sales funnel.
The conversion rate is the percentage of visitors who complete a desired action, like signing up or making a purchase. If your conversion rates are declining, the reason can be friction in the user journey.
View conversion rate data in Graas to identify where struggles occur. Check if the drops are consistent across channels or isolated to a single marketplace or geography.
If the conversion rate problems are limited to your site, there might be some issues with your user experience, page speed, or the checkout process. You can optimize pages, simplify checkout, and test design to remove friction.
However, if conversion rates fall across channels, it may signal broader issues with product listings, descriptions, demand, quality, or pricing.
Careful conversion rate analysis guides you in smoothing the path to purchase and retention. Graas lets you monitor user struggle points across touchpoints so you can identify and fix the right issues.
The Average Order Value (AOV) is the average amount spent on each order. A low AOV can result from changes in product costs, bundling, discounts, or customer segments.
In Graas, track AOV trends across channels to check if the metrics are isolated or widespread. Site-specific AOV drops may come from excessive discounts or low-value customer segments. Limit discounts or redirect marketing to higher-value segments.
However, if the decrease in AOV is consistent across channels, it means a broader negative value perception. Customers may view prices as too high or products as low quality. Competitive research, customer surveys, and value-based messaging could help.
By identifying the source of AOV changes, you can recalibrate product value perception and protect revenue. Graas offers the granular analytics eCommerce businesses need to diagnose and respond.
Are you fixing your eCommerce issues based on your intuition or the so-called “gut” feeling? It's probably not the best approach. You need to make decisions backed by data. You need to treat the cause of the problems, not the symptoms. And that’s where Graas comes in.
Graas allows you to measure every metric that affects your revenue. If something is not performing as expected, drill down into the metrics to find out why. The best part is that the data in Graas is real-time, so you can easily make the much-needed quick decisions. You already know “what” happened. It’s now time to find out the “why”. Sign up for free today!

WhatsApp Chatbots vs AI Sales Agents: Which Drives Higher Conversions for eCommerce Brands?
Read more
How brands use WhatsApp for eCommerce in SEA: The role of AI agents in driving conversions
Read more
From Browsing to Chat: Why Conversations Are Driving eCommerce
Read more
The ROI of Centralizing Marketplace Operations with Execute
Read more
How Enterprise Brands Manage Inventory Across Shopee, Lazada, and TikTok Shop
Read moreChallenges in eCommerce are plenty. They can hit you in multiple ways, like supply chain disruptions or website crashes, with the potential to negatively impact operations and profits.
While implementing quick band-aid solutions, it is easy to fix the symptoms. But it's temporary; the underlying issue stays. To truly fix the core issue and prevent it from happening in the future, eCommerce business owners must find out the root cause.
In this blog, we'll discuss what root cause analysis is in eCommerce. We’ll also provide you with a way to run the root cause analysis for your eCommerce brand to find out why your business is underperforming.
What is root cause analysis in eCommerce?
The biggest challenge for eCommerce businesses to do RCA
How can eCommerce brands conduct root cause analysis with Graas?
Fix the root cause issues with Graas
Whenever you launch a new product or run a campaign, there are expectations around the revenue and profit they will generate. But if the results are not what you expected, it's very human to ask, "Why did this happen?"
Root cause analysis is mainly the process of tracing a problem back to its origin to find the answer to this question. It helps you understand the real reasons why the issues are occurring so you can solve them more effectively.
Once you know the root cause of a problem, you can take preventative steps to stop it from happening again. This allows eCommerce businesses to implement long-lasting solutions rather than temporary quick fixes.
For example, if an eCommerce site experiences a decrease in conversion rate, a root cause analysis would fix the core reason why the conversions are going down instead of just offering more discounts each time.
Root cause analysis is not as easy as it sounds. E-commerce brands and merchants market and sell their products across multiple online platforms. So, data is scattered across different channels. The way they collect, store and process this data can have a big impact on the outcomes. To begin with, data is not homogenous. It comes in various forms, some of which are structured like tables, while others, such as PDF reports, are not. The key is to create structured information from multiple heterogeneous factors. Additionally, the process of extracting and analyzing data is time-consuming, labor-intensive, and prone to human errors. Lastly, data can quickly become outdated, and not having access to real-time information, or worse, relying on outdated data, can lead to disastrous decision-making.
This is where Graas comes in. Graas aggregates data from all the e-commerce marketplaces and channels where you sell, including your own website. This provides you with integrated data from each platform in one centralized place. And when you have this holistic view, you can finally connect the dots between issues across touchpoints to uncover root causes.
Root Cause Analytics is one of the key features of Graas, which helps you diagnose the revenue of your eCommerce brand. It helps you analyze the relationship between the metrics influencing your revenue to identify the primary drivers behind the fluctuations.
When Revenue Diagnostics is run for a selected time period, the key factors contributing to the changes in GMV are identified. The factors with the maximum impact are further analyzed in to navigate toward root cause. The channel with the maximum impact is highlighted at the top.
For each channel, the three core eCommerce metrics are displayed: Traffic, Conversion, and Average Order Value (AOV). These metrics combined form the eCommerce equation which gives you a roadmap to work on your revenue generation.
Traffic is measured as either "total number of page visits" or "number of unique visitors" to all the product pages of your store in a given time period.Declining traffic could indicate many issues like website crashes, search visibility declines, or reduced marketing efforts.
With Graas, you can view detailed traffic data across channels and marketing sources. Check if lower traffic is widespread or limited to specific channels. This helps narrow down the problem.
For example, if traffic drops are limited to your website, the reason can be technical errors that do not allow the visitor to access your store. One of the solutions could be IT troubleshooting and web performance fixes.
But if overall visits are down across channels, ineffective marketing campaigns are likely to be blamed. You can keep drilling down to understand the reason for the dip. Is it onsite or offsite ads, impressions or clicks, specific campaigns or products? By tracing it down to the lowest possible level, you can identify and fix the cause of the issue..
Granular traffic analytics in Graas allows you to pinpoint weak points in customer reach and acquisition. Addressing downward trends here can reopen the top of the sales funnel.
The conversion rate is the percentage of visitors who complete a desired action, like signing up or making a purchase. If your conversion rates are declining, the reason can be friction in the user journey.
View conversion rate data in Graas to identify where struggles occur. Check if the drops are consistent across channels or isolated to a single marketplace or geography.
If the conversion rate problems are limited to your site, there might be some issues with your user experience, page speed, or the checkout process. You can optimize pages, simplify checkout, and test design to remove friction.
However, if conversion rates fall across channels, it may signal broader issues with product listings, descriptions, demand, quality, or pricing.
Careful conversion rate analysis guides you in smoothing the path to purchase and retention. Graas lets you monitor user struggle points across touchpoints so you can identify and fix the right issues.
The Average Order Value (AOV) is the average amount spent on each order. A low AOV can result from changes in product costs, bundling, discounts, or customer segments.
In Graas, track AOV trends across channels to check if the metrics are isolated or widespread. Site-specific AOV drops may come from excessive discounts or low-value customer segments. Limit discounts or redirect marketing to higher-value segments.
However, if the decrease in AOV is consistent across channels, it means a broader negative value perception. Customers may view prices as too high or products as low quality. Competitive research, customer surveys, and value-based messaging could help.
By identifying the source of AOV changes, you can recalibrate product value perception and protect revenue. Graas offers the granular analytics eCommerce businesses need to diagnose and respond.
Are you fixing your eCommerce issues based on your intuition or the so-called “gut” feeling? It's probably not the best approach. You need to make decisions backed by data. You need to treat the cause of the problems, not the symptoms. And that’s where Graas comes in.
Graas allows you to measure every metric that affects your revenue. If something is not performing as expected, drill down into the metrics to find out why. The best part is that the data in Graas is real-time, so you can easily make the much-needed quick decisions. You already know “what” happened. It’s now time to find out the “why”. Sign up for free today!
8 Craig Road, Singapore 089668
Email: info@graas.ai
Follow us on LinkedIn