
Congratulations! Your online store has incredible traffic. You advertised, got on social media, optimized content for search engines, pushed email marketing, and more to ensure buzz on your site. But the real pot at the end of your rainbow is data that captures details about the traffic visiting your online store. Web analytics makes sense of this precious data so that you can make informed decisions. Platforms like Graas help in improving user engagement and conversion rate, thereby increasing eCommerce revenue, on your store using data analytics.
eCommerce stores that use statistical information collected from online marketing and sales activities have reported a 40.38% influence in revenue after just 36 months post-adoption. Clearly, they have an edge over companies not using data analytics.
Imagine you have an online footwear shop that has a lower-than-average number of page views on a Saturday. Wonder what’s up? Well, this could be because you changed Google Ads keywords. Or maybe most of your audience prefers to shop during the week. The only way to understand this is by jumping in.
Knowledge is power and you can learn to experiment with the data available and drive growth for your eCommerce business.
After you have access to data, figure out what it means and how to use it to your advantage. In the case of your footwear store, your analyst may tell you that the keywords needed to be tweaked to regain the Saturday page views. He could ask you to add “party shoes”, for instance.
Data analytics helps you make sense of the information. It’s the process that gathers data from all areas that impact your online store. The information lets you understand trends and changes in behavior of shoe buyers.
Let’s deep dive to find more about this puzzle called eCommerce data analytics
According to Statista, the number of people buying goods and services online is expected to reach 2.14 billion in 2021, up from 1.66 billion global digital buyers in 2016.
The eCommerce industry is expected to double within the next two years and reach 6.54 trillion US dollars in 2022 from 3.53 trillion US dollars in retail eCommerce sales in 2019.
To increase eCommerce revenue and get your business riding this wave, it is vital that you start connecting with and developing a deeper understanding of the empowered consumer. Metrics and analytics bring consumer behavior into the spotlight.
Data from Deloitte

But how to leverage eCommerce data analytics?
Let’s start with figuring out one of the basic concepts of web analytics – funnels. A marketing or sales funnel describes the relationship between you and your potential buyer. Funnel analytics presents your target audience going through a set flow or funnel. Think about an online skincare store:
1. A fan sees a post about sensitive skin on the store’s Instagram page.
2. She clicks on the post.
3. She reaches the landing page, sees a sensitive-skin moisturizer and clicks on ‘add to cart.’
4. She clicks checkout
5. She inputs personal details and buys the moisturizer.
This of course is an ideal scenario. Truth is, each step will see people drop out. To know what might have led to the drops and the psychology of the customer, you need the percentage of dropouts at each stage.
While a bunch of standard tools give website analytics data, Graas eCommerce analytics goes further to deliver store data which is at the heart of decision-making.
Go Beyond basic eCommerce analytics with Predictive AI
Email Marketing: Beyond the blast
Think of an online shoe store. You craft a stunning email campaign to everyone on their list. But basic analytics only tell part of the story. Here's what truly matters:
Engagement Beyond Opens: Track not just opens, but clicks and actions taken on your landing page. This reveals which emails resonate most.
Landing Page Insights: See how many visitors convert (buy something) after clicking your email.
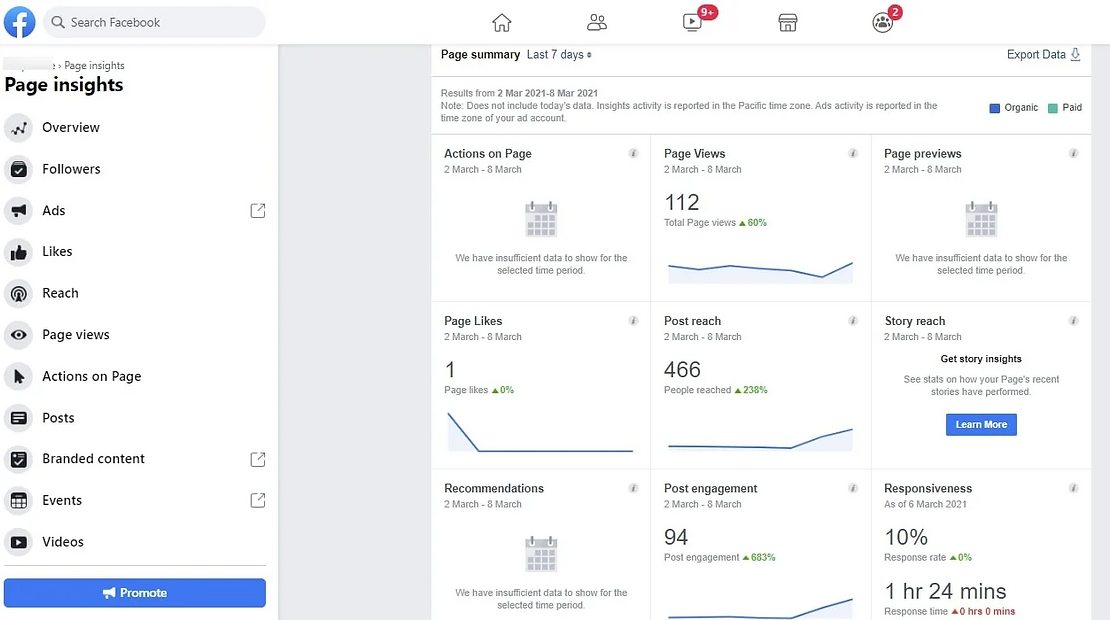
Social Media: Measure what matters
Track every step of your social media funnels. Leverage Facebook Page Insights and Twitter card analytics to understand impressions, clicks, and engagement on your social media posts.
PPC: Decode the Data, Maximize ROI
PPC can be a game-changer for your ecommerce store. But to truly win, you need to understand how your campaigns perform.
Mastering PPC Metrics:
Cost Models: Know the difference between:
CPM (Cost-per-Thousand Impressions): You pay for every 1,000 times your ad is shown.
CPC (Cost-per-Click): You pay for each click on your ad.
CPA (Cost-per-Action): You pay when a visitor completes a desired action (purchase, signup).
Click-Through Rate (CTR): This metric reveals how effective your ad is at grabbing attention. It's the number of ad clicks divided by the number of times it was shown.
Average Position: See where your ad ranks in search results. A higher position typically means more visibility (and clicks).
AI-Powered Optimization
Once you connect with the Graas' Platform, and know how to read the core analytics from various marketing channels, it’s time to move on to the real magic. Your funnel needs to be optimized to increase eCommerce revenue and your marketing money has to be shifted to maximize potential.
Start your optimizing process with A/B testing. This compares two variants of a page element by testing users’ responses to variant A vs variant B to arrive at which variant is more effective. Optimizely is a popular tool for this that can help you improve conversion rate and average order value. If you are diving into optimization, consider using a separate calendar in your Google Calendar to track specific tests. This recording of tests will help you figure out the cause of sudden spikes or dips in sales.
Platforms like Graas fetch customer journey data from different sources such as paid ad data, information from customer relationship management platforms, and email providers, giving you a 360 perspective of the business. You understand what is working and what is not – opening up a goldmine of opportunities.
How can you use data analytics to increase eCommerce revenue?
Recommendation engines:
These are powerful tools that drive your customer towards a purchase and you get to dictate trends. Seen recommendations from Netflix and Amazon as your browse? Those are good examples. Machine learning and deep learning algorithms track every user’s online behavior. They also analyze patterns to make good recommendations.
Market Basket Analysis:
This traditional online retailer’s data analytics tool says that if a person buys one group of things, they are likely to buy another set of items related to the first. For example, if you buy shampoo, you’re likely to buy conditioner too. The algorithms predict the chances of a customer’s buying behavior.
Price optimization:
Did you know that tech can help you fix the best price for your products? The tool offers best price options after considering location, buying attitudes of customers, and competitor pricing.
Inventory analytics:
This is very useful for your eCommerce business especially in times of crises. Think about eCommerce stores during Covid-19: online grocery stores that had inventory well organized were able to thrive as their stocks were available even when demand for products spiked. Inventory data allows platforms like Graas to offer strategies to increase sales, confirm timely delivery and manage your stock.
Customer sentiment analysis:
Machine learning algorithms listen to what your customers are saying about your brand everywhere especially on social media. For example, the skincare brand’s moisturizer buyer might write on Instagram, ‘I love this moisturizer’ or she may write, ‘This product is not great’ on Facebook. Automatically, the algorithm will pick up whether the language used on the different platforms is positive, negative or neutral.
Merchandising analysis:
Retail business and merchandising go hand-in-hand. There are algorithms that analyze merchandising information to suggest priority sets based on trends, relevance and seasonality.
As an eCommerce business owner, data is your friend, not your enemy.
Often, you may be tempted to go by gut feel rather than tech insights. It’s true there are plenty of metrics available out there but it would be best to consider what your unique requirements are and then look at the big picture. If you still feel that data analytics is overwhelming, turn to established expert online platforms like Graas for guidance on how to increase eCommerce revenue. Try it out Graas Platform.